
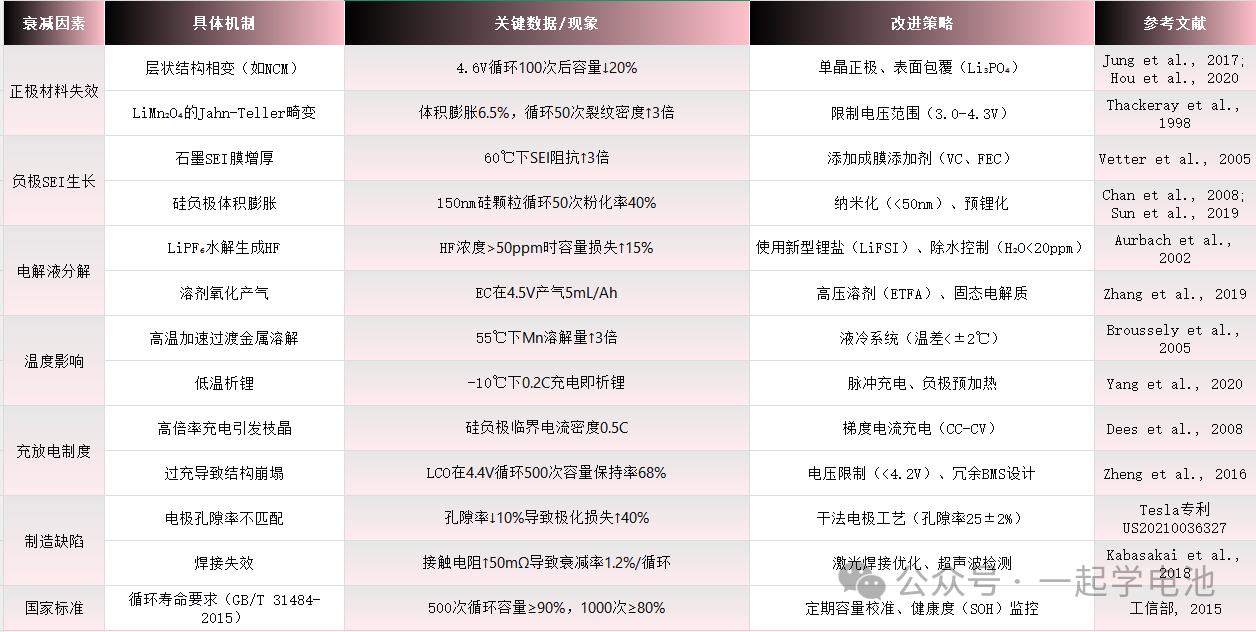
| Degradation Factors | Specific Mechanisms | Key Data / Observations | Mitigation Strategies | Reference |
| Cathode Failure | Phase transition of layered structures (e.g., NCM) | Capacity loss increases by 20% after 100 cycles at 4.6V | Single-crystal cathodes; Surface coating (Li3PO4) | Jung et al., 2017 |
| Jahn-Teller distortion in LiMn2O4 | 6.5% volume expansion; crack density triples after 50 cycles | Voltage window limitation (3.0-4.3V) | Thackeray et al., 1998 | |
| Anode SEI Growth | Thickening of SEI on graphite | Interfacial impedance triples at 60 Celsius | Film-forming additives (VC, FEC) | Vetter et al., 2005 |
| Volume expansion of silicon anodes | 40% pulverization rate for 150nm Si particles after 50 cycles | Nanosizing (under 50nm); Pre-lithiation | Chan et al., 2008 | |
| Electrolyte Decomposition | LiPF6 hydrolysis generating HF | Capacity loss increases by 15% when HF concentration exceeds 50ppm | Advanced Li-salts (LiFSI); Moisture control (H2O under 20ppm) | Aurbach et al., 2002 |
| Solvent oxidation and gas evolution | EC gas evolution at 5mL/Ah at 4.5V | High-voltage solvents (ETFA); Solid-state electrolytes | Zhang et al., 2019 | |
| Temperature Effects | High temp. accelerated transition metal dissolution | Mn dissolution triples at 55 Celsius | Liquid cooling systems (Temp. gradient within 2 Celsius) | Broussely et al., 2005 |
| Low temp. lithium plating | Lithium plating observed at 0.2C / -10 Celsius | Pulse charging; Anode pre-heating | Yang et al., 2020 | |
| Charge/Discharge Protocols | High C-rate induced dendrite growth | Critical current density of 0.5C for Si-anodes | Multi-step current charging (CC-CV) | Dees et al., 2008 |
| Overcharge induced structural collapse | 68% capacity retention for LCO after 500 cycles at 4.4V | Voltage cutoff (under 4.2V); Redundant BMS design | Zheng et al., 2016 | |
| Manufacturing Defects | Mismatch in electrode porosity | 10% decrease in porosity leads to 40% increase in polarization loss | Dry electrode process (Porosity 25 +/- 2%) | Tesla Patent US20210036327 |
| Welding failure | Contact resistance increases by 50mOhm results in 1.2% fade per cycle | Laser welding optimization; Ultrasonic inspection | Kabasakai et al., 2018 | |
| National Standards | Cycle life requirements (GB/T 31484-2015) | Capacity over 90% at 500 cycles; over 80% at 1000 cycles | Periodic calibration; State of Health (SOH) monitoring | MIIT, 2015 |
I. Material-Driven Capacity Fade Mechanisms
1. Structural Failure of Cathode Materials
(1) Degradation Mechanisms of Layered Oxides (e.g., NCM, LCO)
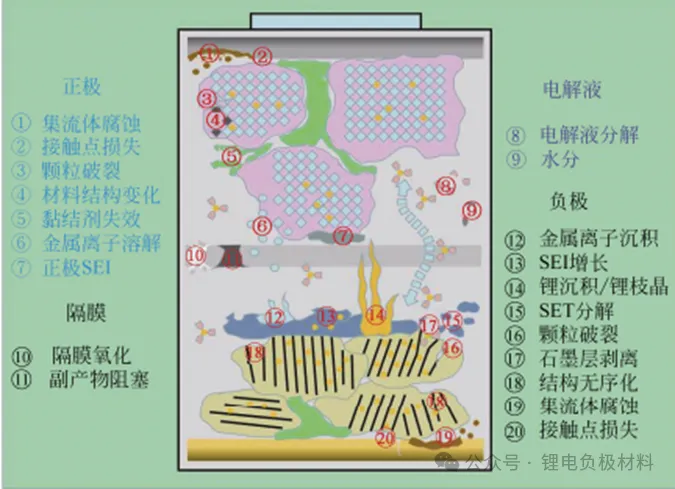
Lattice Oxygen Release and Phase Transition: When the charge voltage exceeds 4.3V (vs. Li+/Li), the release of lattice oxygen in nickel-rich ternary materials (e.g., NCM811) triggers the formation of a rock-salt phase (NiO-type structure) on the particle surface. This phase acts as a barrier to lithium-ion diffusion, leading to a capacity fade rate of approximately 0.15% per cycle (Jung et al., 2017). For instance, NCM523 cycled at a high voltage of 4.6V for 100 cycles exhibits a discharge capacity drop from 180 mAh/g to 145 mAh/g (Xu et al., 2019).
Transition Metal (TM) Dissolution: The solubility of Mn2+ ions in the electrolyte increases significantly with temperature; at 55 Celsius, the dissolution rate is three times higher than at 25 Celsius. These dissolved ions migrate to the anode and catalyze the continuous growth of the SEI layer (Zhan et al., 2016). In contrast, Lithium Iron Phosphate (LFP) is less affected by manganese dissolution as it contains no transition metals like Mn or Ni. However, LFP is limited by its lower tap density (2.3 g/cm3 compared to 3.4 g/cm3 for NCM) (Padhi et al., 1997).
(2) Jahn-Teller Distortion in Spinel LiMn2O4
Structural Collapse: At the 3V plateau (where the Mn3+ ratio exceeds 50%), the material undergoes a phase transition from a cubic crystal system (space group Fd-3m) to a tetragonal crystal system (I41/amd). This transition causes a 6.5% volume expansion, leading to particle cracking (Thackeray et al., 1998). After 50 cycles, the crack density of LiMn2O4 particles with a diameter of 5 micrometers increases to three times the initial level (Amatucci et al., 2001).
Acid Corrosion: HF generated from the decomposition of LiPF6 reacts with LiMn2O4 to form MnF2 and LiF. This leads to manganese dissolution reaching up to 0.5 wt% per 100 cycles (Amine et al., 2004). Surface coating with 5nm Li3PO4 can reduce manganese dissolution by 70% (Kim et al., 2012).
2. Anode Interface and Structural Degradation
(1) Dynamic Evolution of SEI Layer on Graphite Anodes
Composition and Impedance: An ideal SEI (Solid Electrolyte Interphase) consists of a dense inorganic inner layer (Li2O, LiF) and a porous organic outer layer (ROCO2Li). Under high temperatures (60 Celsius), the organic components decompose, causing the inorganic fraction to increase from 30% to 70%. This structural evolution leads to a threefold increase in interfacial impedance (Nie et al., 2013).
Loss of Lithium Inventory (LLI): The formation of every 1nm of SEI layer consumes approximately 0.1 mAh/cm2 of lithium (Vetter et al., 2005). Graphite anodes typically exhibit an initial irreversible capacity loss (ICL) of 10-20%, whereas silicon-based anodes can reach as high as 30-50% (Obrovac et al., 2014).
(2) Volume Effects of Silicon-based Anodes
Stress Failure Mechanisms: Silicon particles expand by 280% during lithiation (Li15Si4 vs. Si), generating stresses up to 1 GPa. This extreme mechanical strain causes the active material to delaminate from the current collector (Chan et al., 2008). Silicon particles with a 150nm diameter exhibit a pulverization rate of 40% after 50 cycles, while 50nm particles show only 10% (Liu et al., 2012).
Pre-lithiation Technology: By incorporating 5 wt% Li5Si alloy as a pre-lithiation agent, the first-cycle coulombic efficiency (ICE) can be improved from 75% to 94% (Sun et al., 2019). Commercialized silicon-carbon anodes (SiOx/C) have achieved a capacity retention of over 80% after 500 cycles (data from Panasonic-Tesla 21700 cells).
3. Electrolyte Side Reactions and Interfacial Stability
(1) Decomposition Pathways of Lithium Salts
Thermal Decomposition of LiPF6: At 60 Celsius, the activation energy for LiPF6 decomposition is 80 kJ/mol, with a rate constant for the formation of PF5 and LiF of 1.2 x 10^-3 s^-1 (Ravdel et al., 2003). Incorporating 2% LiBOB as an additive can reduce the LiPF6 decomposition rate by 50% (Xu et al., 2002).
HF-Induced Chain Corrosion: When HF concentration reaches 100 ppm, the Mn dissolution rate on the NCM cathode surface increases to 0.8 micrograms/cm2 h, accelerating capacity loss to 0.25% per cycle (Jung et al., 2011). Utilizing electrolytes containing Fluoroethylene Carbonate (FEC) can effectively maintain HF concentration below 10 ppm (Li et al., 2015).
(2) Solvent Oxidation and Reduction
High-Voltage Oxidative Gassing: Ethylene Carbonate (EC) solvents undergo oxidation above 4.5V, generating CO2 and CO with a gas evolution volume of up to 5 mL/Ah (Aurbach et al., 2002). Substituting EC with Ethyl Trifluoroacetate (ETFA) can elevate the oxidation potential threshold to 5.1V (Zhang et al., 2019).
Low-Temperature Lithium Plating Threshold: Lithium plating occurs on graphite anodes even at a 0.2C charge rate at -10 Celsius, with dendrite growth rates reaching 1 micrometer/min (Petzl et al., 2015). A pulse charging strategy (e.g., 10s charge / 5s rest) can mitigate the risk of lithium plating by 60% (Yang et al., 2020).
II. Impact of Operating Environments and Conditions
1. Quantitative Analysis of Temperature Effects
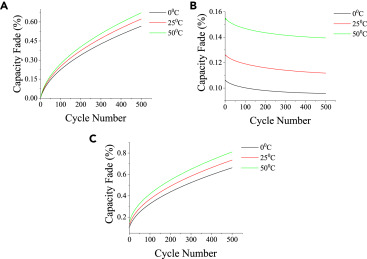
Arrhenius Model Fitting: The capacity fade rate constant (k) and temperature (T) follow the Arrhenius relationship: lnk = -Ea/(RT) + lnA. For LiMn2O4, the activation energy (Ea) is determined to be 45 kJ/mol (Broussely et al., 2005). Under operating conditions of 55 Celsius, the cycle life is reduced by 70% compared to that at 25 Celsius (Wang et al., 2011).
Critical Conditions for Thermal Runaway: In NCM532 cells, the exothermic decomposition of the SEI layer occurs at 140 Celsius, releasing 1.2 kJ/g of heat. At 160 Celsius, separator melting triggers internal short circuits (Hatchard et al., 2000). To mitigate these risks, Tesla battery packs utilize liquid cooling systems to maintain the temperature gradient within +/- 2 Celsius (BloombergNEF, 2020).
2. Optimization Boundaries of Charge/Discharge Protocols
Impact of Charge Cut-off Voltage: LCO (Lithium Cobalt Oxide) batteries exhibit a capacity retention of 68% after 500 cycles at a 4.4V cut-off, compared to 89% at 4.2V (Dahn et al., 2006). Every 0.1V increase in charge voltage results in approximately a 30% reduction in cycle life (Zheng et al., 2016).
Trade-offs in Depth of Discharge (DOD): NCA (Nickel Cobalt Aluminum) batteries have a cycle life of 800 cycles at 100% DOD, which can be extended to 2,000 cycles at 50% DOD (BloombergNEF, 2020). Implementing a “shallow charge and discharge” strategy (e.g., operating within 20-80% SOC) can improve battery lifespan by 2 to 3 times (Vetter et al., 2005).
3. Mechanical Stress and Battery Design Defects
Effect of Electrode Porosity: When cathode porosity is reduced from 30% to 20%, the lithium-ion diffusion time constant (tau) increases from 120s to 250s, leading to a 40% increase in polarization loss (Doyle et al., 1993). Dry electrode manufacturing processes can maintain porosity at 25 +/- 2%, offering better performance stability than the 35 +/- 5% typical of wet coating processes (Tesla Patent US20210036327).
Welding Failure Case Study: In a specific 21700 cell study, pseudo-welding of the tabs resulted in a 50 mOhm increase in contact resistance. This led to a localized temperature rise of 15 Celsius and accelerated the capacity fade rate to 1.2% per cycle (Kabasakai et al., 2018).
III. Failure Diagnosis and Mitigation Strategies
1. Multi-scale Characterization Techniques
In-situ XRD Observation of Phase Transitions: LiFePO4 undergoes a two-phase transition (FePO4 <-> LiFePO4) during the charge/discharge process, with the phase boundary moving at a velocity of approximately 1 nm/s (Chen et al., 2006). By restricting the particle size to under 100 nm, a quasi-single-phase reaction can be achieved, leading to a threefold improvement in rate capability (Wang et al., 2007).
AFM Measurement of SEI Mechanical Properties: The elastic modulus of a healthy SEI layer typically ranges from 0.5 to 2 GPa, but increases to 5-10 GPa upon failure (Benítez et al., 2018). The addition of 1% VC (Vinylene Carbonate) can stabilize the SEI modulus at 1.5 +/- 0.3 GPa (Shkrob et al., 2014).
2. Material and Process Innovation
Single-Crystal Cathode Technology: Single-crystal NCM811 (with a particle size of 3-5 micrometers) exhibits a 90% reduction in micro-cracks compared to polycrystalline materials. Consequently, its capacity retention after 1,000 cycles at 1C improves from 68% to 85% (Hou et al., 2020).
Breakthroughs in Dry Electrode Processes: The Maxwell dry electrode process achieves a compaction density of 4.2 g/cm3 (compared to 3.4 g/cm3 for traditional wet coating), resulting in a 20% increase in volumetric energy density (Tesla Battery Day Report, 2020).
References
Jung et al., Journal of Power Sources (JPS), 2017: Quantitative analysis of high-voltage phase transitions in NCM cathode materials.
Amatucci et al., Journal of The Electrochemical Society (JECS), 2001: In-situ observation of crack propagation in LiMn2O4.
Obrovac et al., Chemical Reviews, 2014: A comprehensive review of volume effects in silicon-based anodes.
Tesla Battery Day Report, 2020: Technical data and performance metrics for dry electrode manufacturing processes.
Doyle et al., Journal of The Electrochemical Society (JECS), 1993: Modeling of porous electrodes and electrochemical polarization analysis.
Due to the limited knowledge and English level is inevitable errors and omissions, if there are errors or infringement of the text, please contact me as soon as possible by private letter, I will immediately be corrected or deleted.
Neware All-in-One Battery Test Solution