
Application of Cyclic Voltammetry (CV) in Lithium Battery Research
Cyclic voltammetry is a commonly used electrochemical testing technique that cyclically scans the electrode potential at a constant rate and measures the corresponding current response.
I. Basic Principles and Testing Methods of Cyclic Voltammetry (CV)
Apply a linearly varying voltage (e.g., from 2.6V to 3.9V and back to 2.6V, at a scan rate of 0.2mV/s for 5 cycles) to the working electrode (e.g., the positive or negative electrode of a lithium battery).
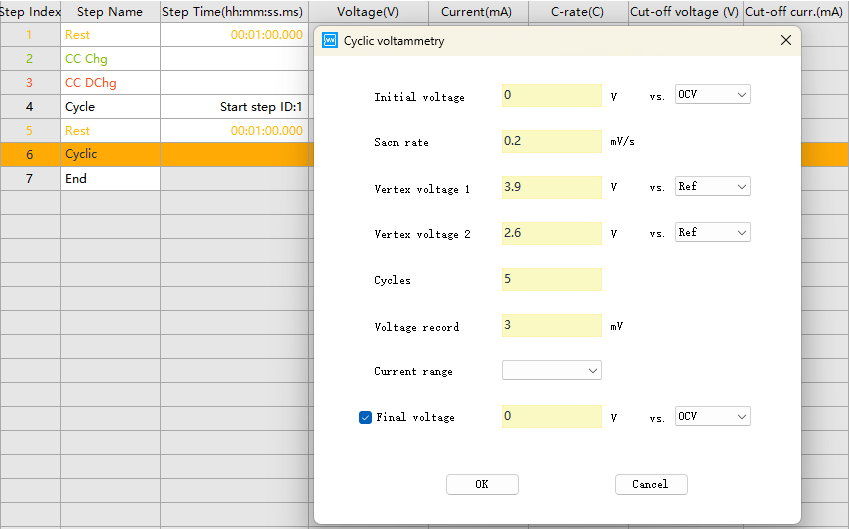
CV step parameter setting in NEWARE software
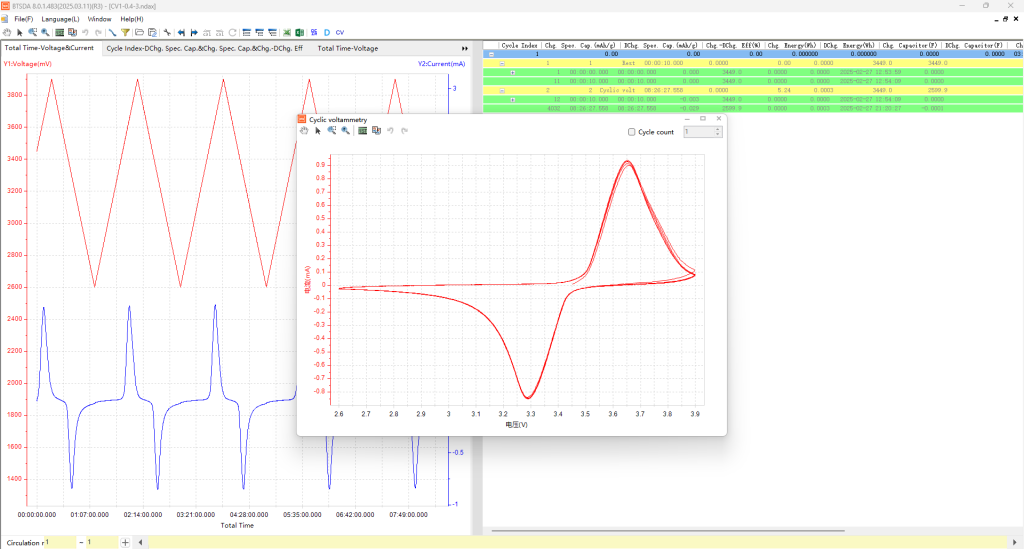
Measurement data: Record the curve of current versus voltage, that is, the cyclic voltammogram.
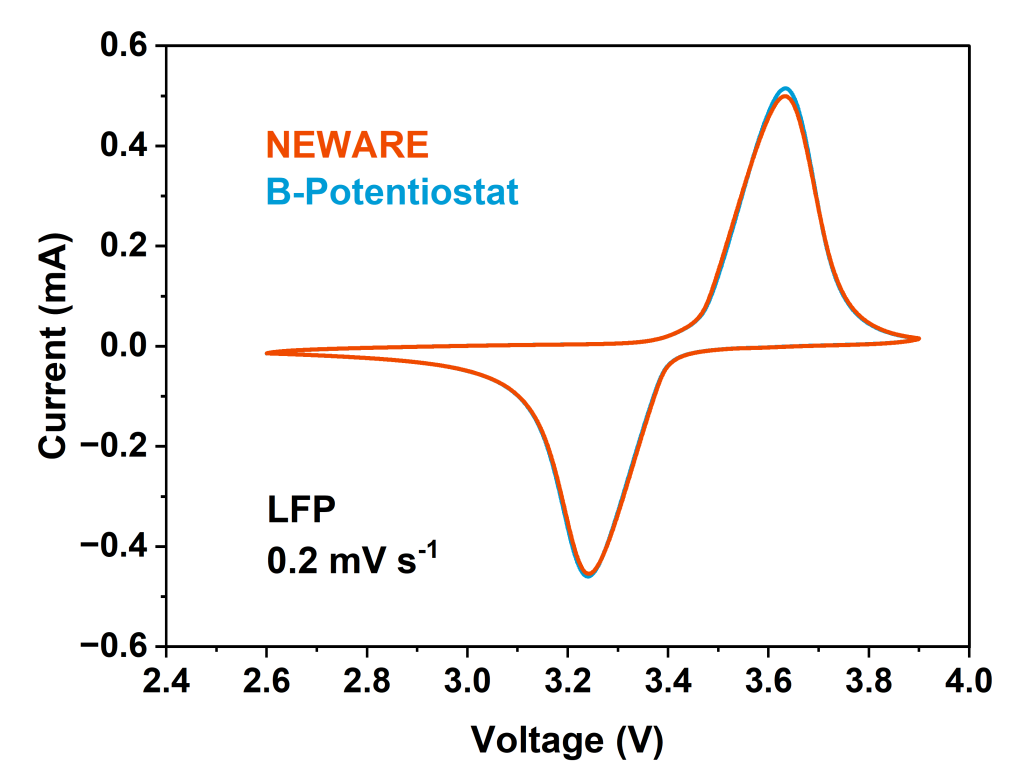
CV curve measured by NEWARE battery testing system
Key Information:
Oxidation Peak/Reduction Peak: Current peaks correspond to electrochemical oxidation (lithiation removal, charging) and reduction (lithiation insertion, discharging) reactions.
Peak Potential (Ep): The voltage corresponding to the peak, reflecting the thermodynamic properties of the reaction.
Peak Current (Ip): The peak height, which is related to factors such as reaction rate and active material content.
Peak Potential Difference (ΔEp): The difference between the oxidation and reduction peak potentials, a key indicator for determining the reversibility of an electrode reaction. For an ideal, reversible single-electron process, ΔEp is approximately 59 mV (at room temperature).
II. Specific Applications in Lithium Battery Research
CV plays a crucial role in all stages of lithium battery research, from basic material screening to failure mechanism analysis.
1. Electrode Reaction Mechanism Research
By analyzing the peak position, shape, and number on the CV curve, it is possible to infer whether the electrode reaction is a single-phase solid solution reaction or a two-phase transition reaction.
Single-phase reactions (such as Li₄Ti₅O₁₂ and some LNMO): The CV curve exhibits broad, symmetrical redox peaks, indicating that lithium ion insertion/extraction is a continuous solid solution process without the formation of new phases, minimal volume change, and generally good cycle life.
Two-phase reactions (such as LiFePO₄): The CV curve exhibits sharp and well-separated oxidation and reduction peaks. This indicates that the reaction proceeds via a nucleation-growth mechanism and the presence of two thermodynamically stable phases (e.g., lithium-rich and lithium-poor phases). The wide separation of the CV peaks for LiFePO₄ is a typical characteristic of a two-phase reaction.
2. Evaluating Electrochemical Reversibility
Peak Potential Difference (ΔEp): A smaller ΔEp indicates lower kinetic resistance and better reversibility. Excessively large ΔEp may indicate significant polarization, including ohmic polarization, electrochemical polarization, and concentration polarization.
Peak Current Ratio (Ipa / Ipc): For a reversible reaction, the ratio of the oxidation peak current to the reduction peak current should be close to 1. A ratio that deviates significantly from 1 indicates the possibility of irreversible side reactions (such as decomposition or gas generation) occurring during the reaction.
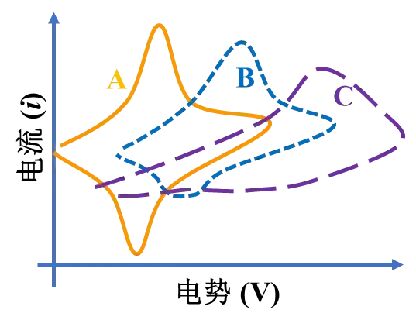
The figure above shows three typical cyclic voltammetry curves. In curve A, the cathode peak and the anodic peak are symmetrical and the peak heights are basically the same, that is, Ipc=Ipa, indicating that the reaction occurring at the electrode/electrolyte interface is highly reversible; in curve B, although both the reduction peak and the oxidation peak exist, the peak intensity of the reduction peak is significantly lower than that of the oxidation peak, indicating that the electrode reaction is partially reversible; in curve C, the oxidation peak is visible while the reduction peak is basically invisible, that is, the ratio of the oxidation peak current to the reduction peak current deviates too much from 1, indicating that the reaction is irreversible.
3. Studying the Formation and Evolution of the Solid Electrolyte Interphase (SEI)
During the first cycle of anode materials (especially silicon and graphite), CV curves can provide critical information on SEI formation.
First Cycle: An irreversible reduction peak typically appears below 1.0 V (vs. Li⁺/Li), corresponding to electrolyte decomposition and SEI formation. The charge consumed by this peak represents irreversible capacity loss.
Subsequent Cycles: This reduction peak significantly weakens or disappears, indicating the formation of a stable SEI that effectively prevents continued electrolyte decomposition. By comparing CV curves from the first and subsequent cycles, the stability of the SEI and the effectiveness of electrolyte additives can be assessed.
4. Identifying Side Reactions and Interfacial Stability
For high-voltage cathode materials: When scanning to high voltages (>4.3 V vs. Li⁺/Li), the appearance of an additional, broad current peak that does not vary with scan rate typically indicates oxidative decomposition of the electrolyte at high voltage. This is a crucial research tool for developing high-voltage electrolytes and additives.
Electrolyte oxidation/reduction decomposition: Any current response that appears outside the expected main reaction peak and has irreversible characteristics may be a signal of a side reaction.
5. Phase Transition and Structural Evolution Studies
For complex materials such as lithium-rich manganese-based cathodes (LRMOs), their CV curves contain multiple redox peaks, corresponding to the redox reactions of different transition metal ions (Ni²⁺/⁴⁺, Co³⁺/⁴⁺) and anions (O²⁻/Oₙ⁻). By analyzing the changes in these peaks over different cycles, we can investigate the structural evolution and phase transition behavior of the material during long-term cycling. For example, a decrease in peak intensity, shift in position, or disappearance indicates a loss of active material or irreversible structural changes.
6. Kinetic Parameter Analysis
By conducting CV tests at different scan rates, we can further explore the kinetics of the electrode reaction.
Relationship between peak current (Ip) and scan rate (v):
Ip ∝ v^(1/2): This indicates that the reaction is diffusion-controlled (i.e., lithium ion diffusion in the solid material is the rate-determining step), which is a common situation for most battery materials. Ip ∝ v: Indicates that the reaction is surface-controlled (i.e., pseudocapacitive behavior). Such materials typically exhibit high rate performance.
Calculating the lithium ion diffusion coefficient (DLi⁺): Using the Randles-Sevcik equation, the chemical diffusion coefficient of lithium ions in an electrode material can be estimated based on the relationship between peak current and scan rate. This is a key parameter for evaluating a material’s rate performance.
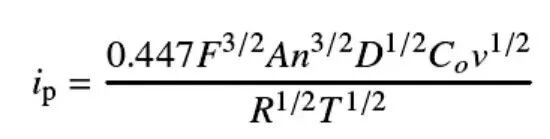
ip = peak current; F = Faraday constant; A = electrode area; n = number of electrons transferred; D = diffusion coefficient; Co = surface concentration; v = scan rate; R = gas constant; T = absolute temperature.
III. Advantages and Limitations
Advantages: Rich information: Acquires thermodynamic and kinetic information simultaneously.
High sensitivity: Capable of detecting subtle side reactions and phase transitions.
Highly intuitive: The chromatogram format is highly intuitive, facilitating comparisons between different materials.
Available: A standard feature of electrochemical workstations.
Limitations: Primarily qualitative: Primarily used for mechanistic and qualitative analysis, its quantitative capabilities are inferior to methods such as the galvanostatic intermittent titration technique (GITT).
Highly affected by test conditions: Parameters such as scan rate and voltage range significantly influence the results and require careful setting.
Unsuitable for high-rate measurements: High scan rates can lead to significant polarization, distorting the chromatogram and making it difficult to reflect equilibrium information.
IV. Summary
Cyclic voltammetry is like a stethoscope for lithium battery research. By “listening” to the current response to voltage changes, it can “diagnose” the complex reactions occurring within the electrode: whether it’s intercalation or phase transition, reversibility or a side reaction, interface stability, and fast or slow kinetics. It serves as a critical bridge between fundamental materials research (synthesis and structure) and actual electrochemical performance (capacity, rate capability, and cycle life), and is an indispensable and powerful tool for developing and optimizing the next generation of high-performance lithium battery electrode materials and electrolytes.
Due to the limited knowledge and English level is inevitable errors and omissions, if there are errors or infringement of the text, please contact me as soon as possible by private letter, I will immediately be corrected or deleted.
Contact me if you want to know more details.