
Since lithium-ion batteries (such as cylindrical or pouch cells) typically operate within closed systems to ensure cycling stability and safety, their internal physicochemical states remain difficult to observe directly. Consequently, external electrochemical testing is essential for characterizing and estimating internal cell information.
During the charging and discharging process, cell voltage fluctuates according to the Depth of Discharge (DOD). By recording parameters such as voltage, capacity, State of Charge (SOC), and time, we can plot charge-discharge curves that reflect the battery’s electrochemical characteristics. These curves contain critical data regarding polarization phenomena, phase transitions, and kinetic limitations, serving as the foundation for analyzing battery performance.
The following sections introduce several common types of charge-discharge curves used in the industry:
Battery Charge and Discharge Curves I: Time-Current/Voltage Curves
1. Constant Current (CC)
During constant current charge and discharge, the current is maintained at a fixed value while the change in the battery’s terminal voltage is recorded; this is commonly used to detect the discharge characteristics of the battery. Throughout the discharge process, the discharge current remains constant while the battery voltage decreases, leading to a continuous decline in discharge power. The sample curve is shown in the figure below.
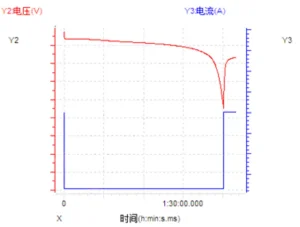
2. Constant Current Constant Voltage (CCCV Charging)
Unlike simple constant current charging, CCCV charging includes a constant voltage stage at the end of the charging process. When the terminal voltage reaches the target threshold, the system switches from constant current to constant voltage; during this phase, the current gradually tapers off until it hits the specified cutoff current, marking the completion of the cycle. Because battery voltage fluctuates significantly after leaving the voltage plateau, relying solely on constant current would prevent the cell from reaching an ideal full state of charge (SOC). Therefore, transitioning to a constant voltage while reducing the current is necessary to ensure the battery reaches the highest possible SOC. The sample curve is shown in the figure below.
WEBP-300x280.webp)
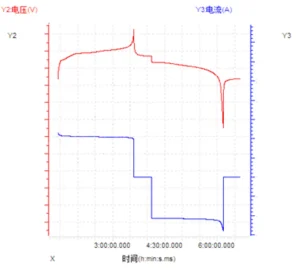
3. Constant Power (CP)
The entire charge-discharge process operates at a constant power level. Based on the formula P = UI, during constant power charging, the voltage gradually rises while the current decreases; conversely, during constant power discharge, the voltage gradually drops while the current increases. Taking the standard cutoff voltage range of an LFP battery (3.65V to 2.5V) as an example, the current at the end of discharge can reach nearly 1.5 times the current at the end of charging. The sample curve is shown in the figure below.
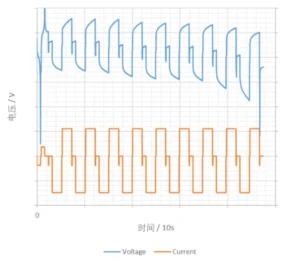
4. Continuous, Intermittent, and Pulse
While maintaining constant current or power, timing functions can be utilized to achieve control over continuous, intermittent, and pulse charge-discharge cycles. These specialized charging and discharging regimes are frequently employed to evaluate the Direct Current Internal Resistance (DCIR) of the battery. The sample curves are shown in the figure below.
Battery Charge and Discharge Curves II: Capacity-Voltage Curves
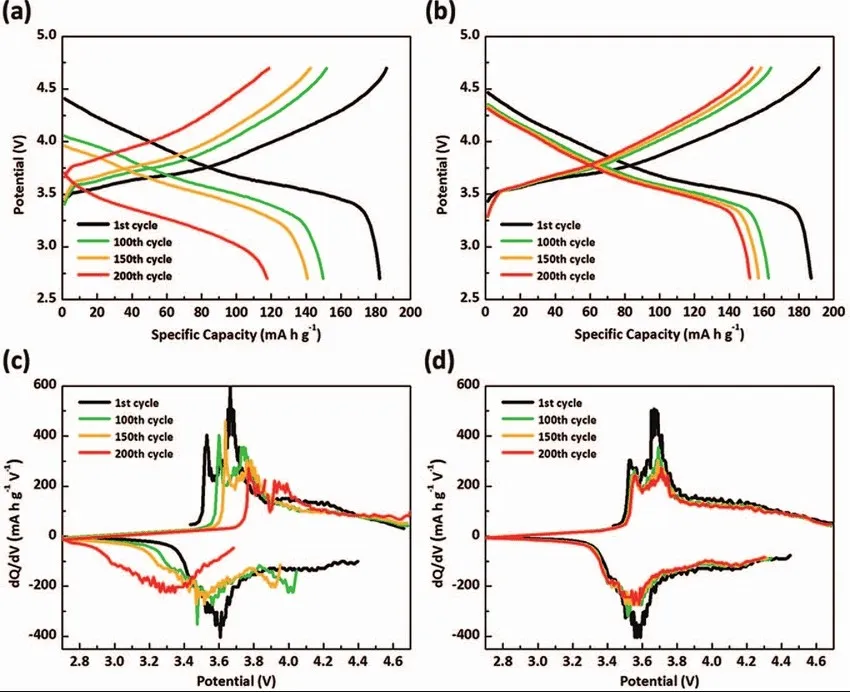
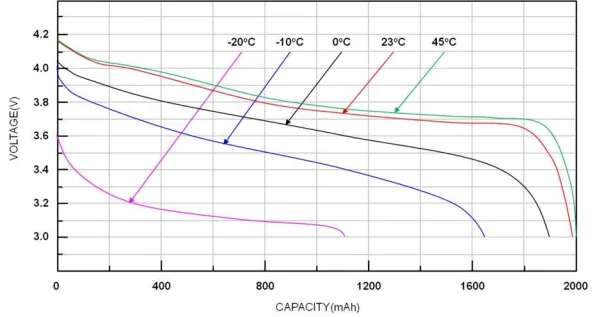
The horizontal axis of the capacity-voltage curve reflects information such as the battery’s charge/discharge capacity and State of Charge (SOC), while the vertical axis contains data regarding the battery’s voltage plateau, inflection points, and polarization. The figure below illustrates the discharge curves of a Lithium Iron Phosphate (LFP) battery at various temperatures.
Battery Charge and Discharge Curves III: C-rate Curves
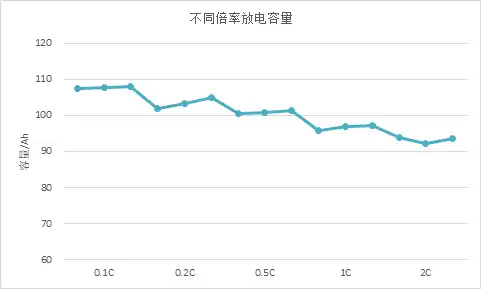
The magnitude of current density influences the rate of electrochemical reactions, thereby altering the battery’s performance parameters. When comparing batteries of different capacities, using the same absolute current is impractical; therefore, C-rate is used to define a relative current. For instance, a 0.1C rate corresponds to 0.3A for a 3Ah 18650 cell, whereas it represents 28A for a 280Ah prismatic cell. Simply put, the specific current value represented by the C-rate is calculated by multiplying the rate by the battery’s nominal capacity.
When labeling a battery’s capacity, the charge and discharge current must be taken into account, as capacity varies across different C-rates. To calibrate or characterize a battery’s capacity under various conditions, one can set the C-rate to change incrementally across successive charge-discharge cycles. By plotting the discharge capacity on the vertical axis against the cycle number on the horizontal axis, a C-rate curve is generated.
Battery Charge and Discharge Curves IV: dQ/dV Curves
The dQ/dV Curve: A Comprehensive Analysis of Its Significance and Applications in Electrochemistry
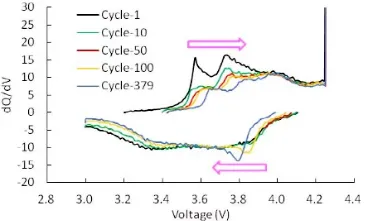
The name of the dQ/dV curve is derived from its Y-axis variable, which represents the rate of change in capacity per unit of voltage. The X-axis typically represents SOC, capacity, or voltage, reflecting changes in the capacity derivative. Areas with a high rate of change appear as characteristic peaks on the curve, which generally correspond to specific electrochemical reaction processes.
The dQ/dV curve identifies the battery’s voltage plateaus, indicates when electrochemical reactions occur, and reveals how these reaction processes shift as the battery ages or undergoes other state changes. Since electrochemical reactions are often rapid, the data points on the curve require high precision. Consequently, generating a dQ/dV curve places certain demands on raw data acquisition; otherwise, it is impossible to produce a curve with distinct peaks. During charge-discharge testing, data can be collected by setting a voltage interval (Delta V) of 10–50 mV or a time interval (Delta t) of 10–50 ms, followed by filtering the raw data for equal voltage increments.
The figure below shows the dQ/dV curves at different cycle numbers.
Battery Charge and Discharge Curves V: Cycle Life Curves
As we know, battery life is categorized into calendar life and cycle life. Calendar life refers to the time elapsed before the battery capacity degrades to a specific level under shelf conditions (natural aging), whereas cycle life represents the number of charge-discharge cycles a battery can undergo before its capacity decays to a defined threshold. Cycle life is one of the most critical indicators for evaluating a battery’s longevity performance.
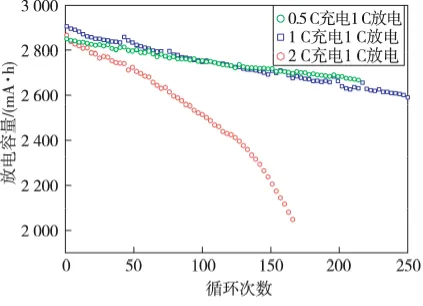
Cycle life test data is the accumulation of individual charge-discharge cycle data. Various metrics can be extracted from each cycle to plot different curves for multi-faceted analysis. The most fundamental cycle life curve uses the cycle number as the x-axis and discharge capacity or capacity retention rate as the y-axis. As shown in the figure below, the battery capacity continuously decays as cycling progresses, and the specific charge-discharge regime has a significant impact on the rate of this capacity degradation.
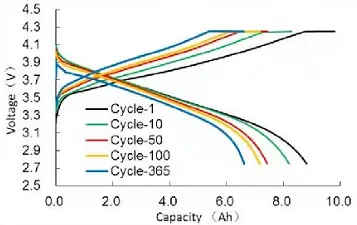
You can also compare Battery Charge and Discharge Curves (Capacity-Voltage) from different periods of the battery’s lifespan. As shown in the figure below, as cycling progresses, the starting voltages for both charging and discharging shift, indicating a change in the battery’s Direct Current Internal Resistance (DCIR), while the charge-discharge capacity gradually attenuates.
Besides the two types mentioned above, there are many other curves that use the cycle number as the horizontal axis and various parameters affected by battery degradation as the vertical axis. These play a crucial role in analyzing the factors that influence cell cycle life and in predicting service longevity.
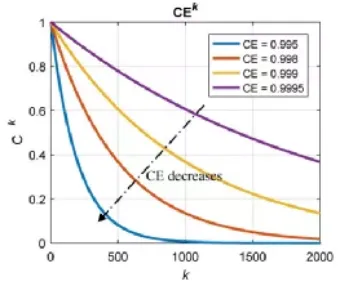
As shown in the figure below, the chart illustrates the theoretical relationship between a battery’s cycle life and its Coulombic Efficiency (CE) level. In this context, CE represents Coulombic efficiency, Ck represents the capacity retention rate, and k represents the cycle number.
After exploring various charge-discharge curves, you should now have a clearer understanding of the different aspects of lithium-ion battery performance.
Batteries are complex electrochemical and thermodynamic systems influenced by multiple factors. While battery chemistry is the most critical driver, other variables—such as charge/discharge rates, operating temperatures, storage conditions, and physical structural details—must be considered when determining which battery is best suited for a specific application. To navigate this, we must first define several key terms:
Open Circuit Voltage (Voc): The voltage between the battery terminals when no load is applied. More: How to analyze the OCV curve of an LFP battery?
Terminal Voltage (Vt): The voltage between the battery terminals when a load is applied; it is typically lower than Voc due to internal resistance.
Cut-off Voltage (Vco): The specified voltage at which a battery is considered fully discharged. Although some energy may remain, operating below Vco can cause permanent damage.
Capacity: A measure of the total Ampere-hours (Ah) a battery can provide from a fully charged state until Vt reaches Vco.
C-Rate: The rate at which a battery is charged or discharged relative to its rated capacity. For example, a 1C rate will fully charge or discharge a battery in 1 hour, while a 0.5C rate will take 2 hours. High C-rates typically reduce usable capacity and can damage the cell.
State of Charge (SoC): Quantifies the remaining battery capacity as a percentage of its maximum capacity.
Depth of Discharge (DoD): The complement of SoC, measuring the percentage of capacity that has been discharged (DoD = 100% – SoC).
Cycle Life and Longevity
Cycle Life: The number of usable charge-discharge cycles a battery can complete before reaching the end of its functional life.
End of Life (EoL): The point at which a battery can no longer perform according to its minimum specified requirements. EoL can be quantified in several ways:
Capacity Fade: Based on a specific percentage drop in battery capacity compared to its rated capacity under defined conditions.
Power Fade: Based on a specific percentage drop in the battery’s maximum power output.
Energy Throughput: Quantifies the total amount of energy (e.g., 30 MWh) a battery is expected to process over its entire lifespan based on specific operating conditions.
State of Health (SoH): Measures the percentage of remaining useful life left in the battery before it reaches EoL.
Polarization Curves
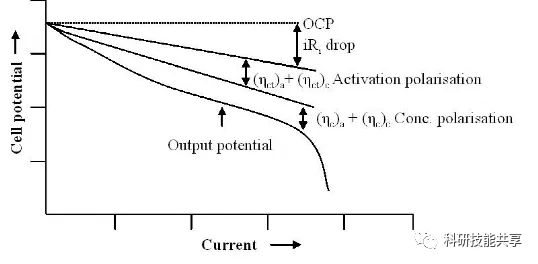
The battery discharge curve is shaped by the polarization effects that occur during the discharge process. The amount of energy a battery can deliver under different operating conditions—such as C-rate and operating temperature—is closely related to the area under its discharge curve. During discharge, the terminal voltage (Vt) drops due to several primary factors:
IR Drop: This is the decrease in battery voltage caused by current flowing through the battery’s internal resistance. At a constant temperature, this factor increases with a baseline linear slope as the discharge rate increases.
Activation Polarization: This refers to various retarding factors associated with the kinetics of electrochemical reactions, such as the work function that ions must overcome at the interface between the electrode and the electrolyte.
Concentration Polarization: This factor accounts for the resistance faced during mass transfer (diffusion) as ions are transported from one electrode to another. This factor becomes dominant when a lithium-ion battery is nearing full discharge, causing the slope of the curve to become very steep.
Factors Influencing Discharge Curves
Batteries are designed for a wide range of applications, offering diverse performance characteristics. For example, there are at least six basic Lithium-ion (Li-ion) chemistries, each with its own unique set of features. Discharge curves typically plot Terminal Voltage (Vt) on the Y-axis and State of Charge (SoC) or Depth of Discharge (DoD) on the X-axis. Since performance is tied to parameters like C-rate and operating temperature, each chemistry has a family of discharge curves based on specific combinations of these operating parameters.
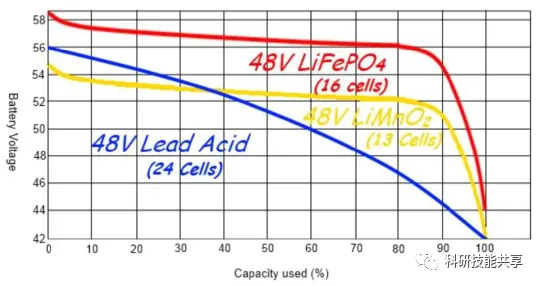
The figure below compares the discharge profiles of two common Li-ion chemistries and a Lead-Acid battery at room temperature and a 0.2C discharge rate. The shape of these curves is of significant importance to designers:
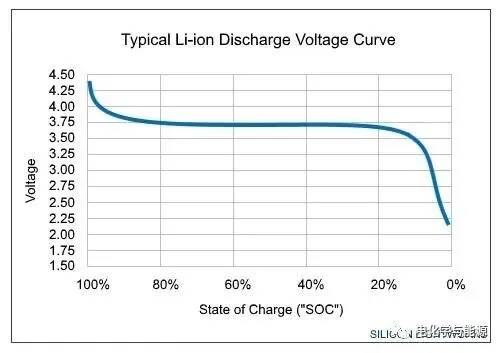
Flat Discharge Curves: These simplify application design because the battery voltage remains relatively stable throughout the entire discharge cycle.
Sloping Curves: These make it easier to estimate the remaining charge, as the battery voltage is closely correlated with the remaining capacity. For Li-ion batteries with flat discharge curves, estimating remaining charge requires more complex methods like Coulomb Counting, which measures and integrates the discharge current over time.
Furthermore, batteries with a downward-sloping discharge curve experience a drop in power throughout the cycle. In high-power applications, it may be necessary to “oversize” the battery to support performance at the end of the discharge cycle. Sensitive equipment using batteries with steep discharge curves often requires boost regulators to maintain a steady power supply.
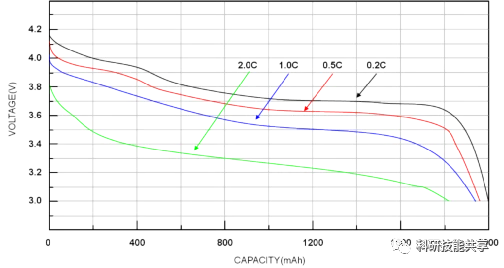
The following discharge curve for a Lithium-ion battery shows that if a battery is discharged at a very high rate (or conversely, at a low rate), the effective capacity will decrease (or increase). This phenomenon is known as Capacity Offset, and it is common across most battery chemistries.
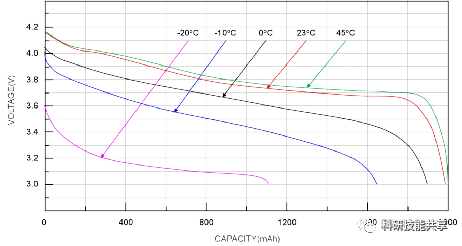
Operating temperature is a critical parameter affecting battery performance. At extremely low temperatures, batteries with aqueous electrolytes may freeze, placing a strict lower limit on their operational range. For lithium-ion batteries, low-temperature operation can cause lithium plating on the anode, which leads to a permanent reduction in capacity. Conversely, at high temperatures, chemical components may decompose, causing the battery to fail. Between the extremes of freezing and chemical breakdown, battery performance typically fluctuates significantly with temperature changes.
The figure below illustrates the impact of temperature on lithium-ion battery performance. At very low temperatures, performance can be substantially degraded. However, the discharge curve represents only one aspect of battery performance. For instance, the further the operating temperature deviates from room temperature—whether hotter or colder—the more the cycle life of a lithium-ion battery is reduced.
A complete analysis of all factors affecting the suitability of various battery chemistries for specific applications is beyond the scope of this discussion on discharge curves. Another common method for analyzing and comparing different battery performance characteristics is the Ragone plot, which maps power density against energy density.
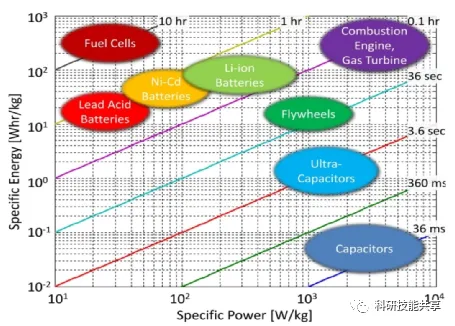
Ragone Plots
Ragone plots compare the specific power versus specific energy of different energy storage technologies. For example, when considering batteries for electric vehicles, specific energy is directly related to the driving range, while specific power corresponds to acceleration performance.
The Ragone plot is based on mass-based energy density and power density; it does not include information regarding volumetric parameters. Although metallurgist David V. Ragone originally developed these charts to compare the performance of various battery chemistries, Ragone plots are equally useful for comparing any set of energy storage and power devices, including engines, gas turbines, and fuel cells.
The ratio between the specific energy on the Y-axis and the specific power on the X-axis represents the number of hours the device can operate at its rated power. The size of the device does not affect this relationship, as a larger device will have proportionally greater power and energy capacity. On a Ragone plot, the isochrones representing constant operating time appear as straight diagonal lines.
Summary
Understanding battery discharge curves and the various parameters that constitute the curve families for specific chemistries is essential. Because batteries are complex electrochemical and thermodynamic systems, their discharge curves are multifaceted. However, they are just one of several ways to understand the performance trade-offs between different battery chemistries and structures.