
Coin Cells: From Electrode Preparation to Performance Testing (3)
Basic Data Analysis
Voltage Analysis
The open-circuit voltage of an assembled lithium-ion battery refers to the potential difference between the positive and negative terminals when no current flows through the external circuit. It can be measured directly with a multimeter (accuracy of no less than 0.1 mV, it is recommended to use a dedicated voltmeter with high internal resistance to prevent self-discharge) or read directly after connecting to a battery testing system. This value is only the initial open-circuit voltage after the battery is assembled, while the open-circuit voltage at full state of charge (SOC) needs to be measured by a constant current intermittent titration (GITT) method, which will be introduced in a subsequent article. The working voltage refers to the instantaneous potential difference between the positive and negative terminals when current flows through the external circuit and can be directly reflected in the data from the battery testing system. The working voltage U = E0 ± IRi, where E0 is the thermodynamic equilibrium voltage, Ri is a specific resistance present in the button cell battery’s interior or contact, such as the ohmic resistance of a structural component, charge transfer impedance, or diffusion impedance, and I is the test current. The working voltage is related to the magnitude of the current.
Discharge average voltage analysis then requires an equation for the curve, namely![]()
Q is the battery capacity (A-h), I is the current (A), and t is the test time (h). 1 mAh is equivalent to 3.6 coulombs. In general, capacity data can be read directly in the test system software.
For the battery material under test, capacity analysis generally needs to determine three data: first charge capacity, first discharge capacity (cathode material) and reversible capacity. a. First charge capacity is the capacity of the battery material under test, which is the capacity of the battery material under test.
a. The first charging capacity is the charging capacity of the lithium-ion battery at the end of the first charging;
b. The first discharge capacity is the discharge capacity of the lithium-ion battery at the end of the first discharging;
c. The reversible capacity is the capacity of the battery after the cycle stabilization (the test value at room temperature, also known as the rated capacity), and the discharge capacity of the 3rd to 5th week is generally selected, and sometimes it may be necessary to select the capacity of the discharging capacity after 10 weeks.
In practical application, the analysis of gram capacity, surface capacity and volume capacity of the test material or pole piece is more reference value. For example, the gram capacity is the discharge capacity per unit mass of active material, C=Q/m; the surface capacity is the discharge capacity per unit area of the test pole piece, C=Q/S; the volume capacity is the discharge capacity per unit volume of the pole piece, C=Q/V. In the formula, C is the discharge specific capacity mA-h/g (milliampere per gram), mA-h/cm2 (milliampere per square centimeter), or mA-h/cm3 (milliampere per cubic centimeter), Q is the discharge capacity mA-h (milliampere per cubic centimeter), m is the active capacity mA-h (milliampere per cubic centimeter), and m is the active capacity mA-h (milliampere per gram). cubic centimeter), Q is the discharge capacity mA-h (milliamperes per hour), m is the mass of the active material g (grams), S is the area of the test pole piece cm2 (square centimeters), and V is the volume of the test pole piece cm3 (cubic centimeters). The gram capacity parameter is more intuitive for comparing the performance of the test material, while the surface capacity and volume capacity are more informative for the practical application of the test material and the matching of positive and negative electrode capacities. It is recommended to provide information on all 3 specific capacities at the same time when publishing an article.
Button battery data can also evaluate the energy density (W) of positive active material, which refers to the energy that can be stored and released per unit mass of positive active material, W=EQ/m, i.e., the product of the average voltage of discharge and the gram capacity, commonly used unit of W-h/kg (often referred to as specific energy), and also includes the volumetric energy density of W-h/L. Generally, the positive active material in the battery cell occupies the mass ratio of 30%~50%, and the specific ratio depends on the specific capacity of positive and negative materials. 50%, and the specific ratio depends on the compaction density and real density of the anode material. Therefore, according to the energy density of cathode active material, the energy density of the corresponding full battery can also be roughly estimated, which is of reference significance for those who do not have the conditions to develop full batteries but want to evaluate the cathode material and predict the energy density of the cell.
Charge/discharge curve analysis The charge/discharge curve reflects the charge/discharge behavior of the battery material, and the analysis of the charge/discharge curve of the button battery is of great significance to the understanding of the material performance and electrochemical behavior, especially for the analysis of the charge/discharge curve of the half-battery, which is able to analyze the characteristic behavior of a certain material in a targeted manner. Charge/discharge curves can be presented in several different forms, such as the more common “crossover” curve (Figure 1) and “cyclic” curve (Figure 2).
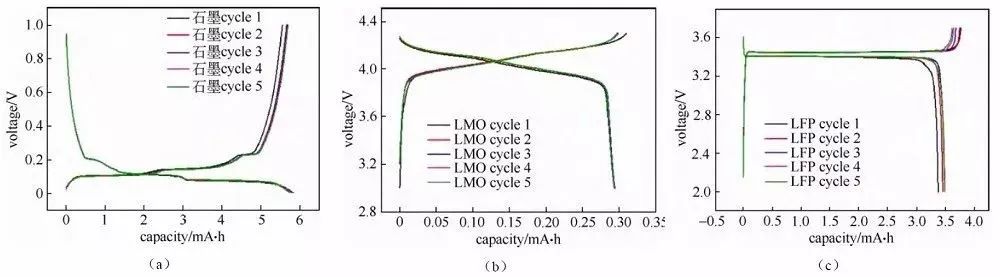
Fig. 1 Charge-discharge curves of half-cells assembled with several different materials.
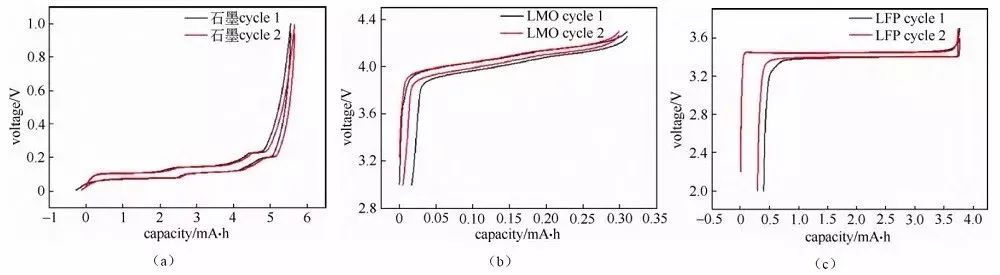
Fig. 2 “Cyclic” charging and discharging curves of half-cells assembled with several different materials.
A large amount of data information can be read from the button battery charge/discharge curve, the following is a brief introduction to the reading and analysis of some data.
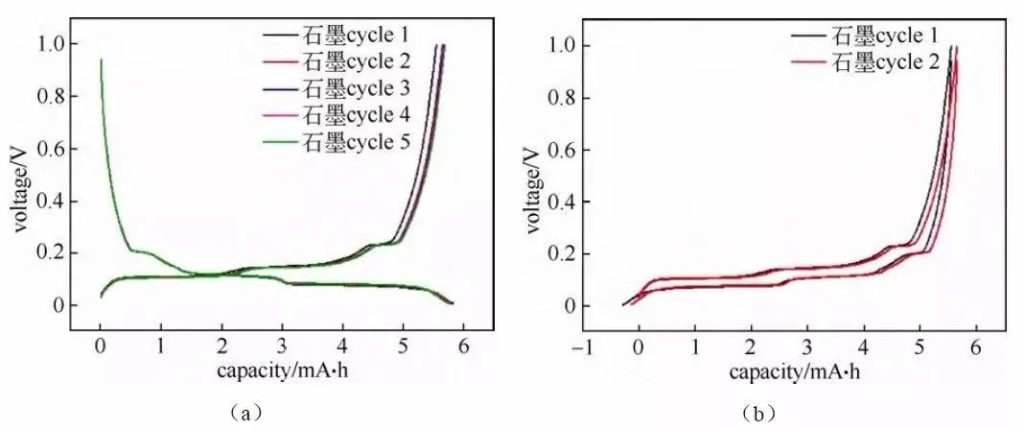
Fig. 3 Charge/discharge curves of graphite/lithium metal chip half-cells
The de-embedding of lithium ions within the positive and negative electrode materials corresponds to the platform or slope regions on the charging and discharging curves (as well as the redox peaks in the cyclic voltammetry curves and differential differential capacitance curves), and based on the changes in each platform region the electrochemical reaction behavior of the materials can be analyzed and studied. Usually the number of potential platforms or slopes for charging and discharging is the same. If the total capacity of charging and discharging is the same, but the corresponding capacity of each platform/slope is different, then it means that there is a significant difference in the thermodynamic reaction paths of the material embedded and delithiated lithium or the kinetic properties of embedded and delithiated lithium. Figure 3 shows the charge-discharge curves of a typical graphite anode material. The charge/discharge curves show that, when the graphite/lithium metal chip half battery is charged and discharged, there are three corresponding obvious charge/discharge platforms at 0.08/0.1 V, 0.11/0.14 V, and 0.2/0.22 V in the graphite electrode charge/discharge process, which corresponds to the two-phase transition process of three lithium-graphite interlayer compounds, respectively. The start point of the plateau, which corresponds to the beginning of the phase transition, and the termination point of the plateau, which corresponds to the end point of the phase transition, and the plateau behavior implies that the electrochemical potential of the host material is independent of the occupancy of ions in the material.
The slope in the charge-discharge curve generally corresponds to the solid-solution reaction or capacitive behavior, and the slope behavior implies that the electrochemical potential of the host material is directly related to the occupancy of ions in the material. Therefore, the charge-discharge curves can be used to initially determine how many phase transition reactions there are in the material during the reaction process, whether it is a two-phase transition reaction or a solid-solution, adsorption-desorption capacitive behavior, which can assist in guiding the structural studies such as X-ray diffraction. Under the same SOC, when charging and discharging with small current, the intermediate value of the voltage between the charging potential plateau and the discharging potential plateau is approximated as the thermodynamic equilibrium potential, and it is easier to accurately estimate the value of the intermediate potential between the oxidation peaks and the reduction peaks corresponding to the cyclic voltammetry curves or differential differential capacitance curves. The measurement of accurate thermodynamic equilibrium potentials at full SOC is recommended to use the GITT method at low current density.
In the full battery discharge behavior, the discharge voltage of the battery is the embedded lithium voltage of the cathode material minus the delithiation voltage of the negative material, so the higher the average delithiation plateau of the negative electrode, the lower the discharge voltage of the full battery. When the anode material delithiation platform exceeds 2.0 V, the full battery voltage is already very low, and the measured capacity at this time has little significance for the full battery matching and practical applications, because each electrical application has a permissible lower voltage range, such as lithium-ion batteries generally used in consumer electronics appliances discharge voltage cutoff to 2.7 V.
The energy efficiency, which is the ratio of the discharged energy to the charged energy for the same cycle, can be expressed as η = (EDQD) (/ ECQC) x 100%. In the charge/discharge curve, it can be approximated as the integral area difference of the charge/discharge curve, and the change of this value is easier to read in the “cyclic” charge/discharge curve. Typical lithium-ion batteries have energy efficiencies in the range of 92% to 95%, while lithium-sulfur and lithium-air batteries have energy efficiencies in the range of 80% and 70%, respectively.
Analyzing the first 5 weeks of charge/discharge cycle data, we can obtain the first week discharge capacity, first week charge capacity, first week coulombic efficiency, reversible capacity, polarization voltage and resistance, energy efficiency and other information.
The first week charge/discharge data is the most important. The first week discharge capacity can be read directly in the curve, which is used to analyze the actual capacity released by the pole piece after the first week cycle. The first week charging and discharging platform of the battery lays the foundation for the subsequent cycles, and whether the structure of most materials is stable or not is also generated by the 1st week, and the length of the platform also affects the embedding and discharging efficiency of lithium ions. The charging and discharging capacity in the 2nd and subsequent weeks also basically rises and falls on the basis of the discharging capacity in the first week. Coulombic efficiency (i.e. charge/discharge efficiency) is the ratio of battery discharge capacity to charge capacity during the same cycle, i.e. η=QD/QC×100%, and the first-week Coulombic efficiency (i.e. first efficiency) is the ratio of the battery’s discharge capacity to its charge capacity in the first week (η=QD1/QC1×100% for positive materials). A number of battery test systems can directly output this value, which can be used to analyze the capacity of the pole piece consumed by activation and other reactions during the first week of cycling, and can directly characterize the stability of the material structure and the advantages and disadvantages of the kinetic performance.
The first discharge capacity and the first-week coulombic efficiency can directly influence the design of the whole battery and the evaluation of materials. The Coulombic efficiency in the first 5 weeks generally shows a trend of increasing and then decreasing or small fluctuation, which is due to the irreversible loss of active lithium source caused by reactions such as SEI film growth and material activation during the first few weeks of cycling. In the case of a half battery with fresh anode material, for example, the first discharge capacity is higher than the first charge capacity, i.e., the first lithium embedded in the anode is more than the first lithium removed from the anode. If the test result is opposite, it may be due to factors such as non-fresh pole pieces or short circuit of the battery.
The highest capacity, i.e. the highest value of capacity shown during the charging and discharging process of the test battery, usually appears in the first five weeks of charging and discharging. The test results of some anode materials show a continuous increase in reversible capacity with the increase in the number of cycles, which is related to the continuous oxidation of the material, slow activation, continuous growth of the SEI film, and the gradual participation of other materials in the oxidation reaction. This type of anode material is a disadvantage rather than an advantage for the design and application of lithium-ion full batteries. In general, the reversible capacity measured by the battery will tend to be relatively stable in the first 5 weeks, and the fact that the Coulombic efficiency does not reach 99.95% quickly means that the interface or material structure has been unstable, and such a material used for full battery testing will have much poorer cycling performance compared to a half cell.
Analysis of cell polarization
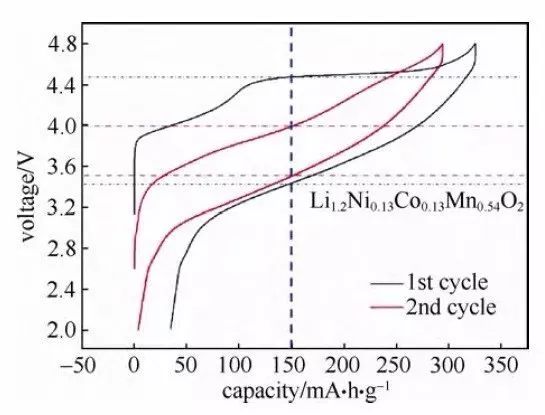
Fig. 4 Charge-discharge curve of lithium-rich cathode material (Li1.2Ni0.13Co0.13Mn0.54O2)
Polarization is unavoidable in the charge/discharge process of Li-ion batteries, especially in the high rate charge/discharge process. It is necessary to study the capacity change caused by polarization and analyze the polarization according to the charge/discharge curve. Compared with analyzing the kinetics of electrode process by GITT, constant voltage intermittent titration (PITT) or electrochemical alternating current impedance spectroscopy (EIS), the kinetic information obtained by the charge/discharge curve is more intuitive. Typically, capacities measured at lower charge/discharge multiplicities (e.g., 0.05C, 0.02C, 0.01C or lower, depending on the material) can essentially ignore changes in capacity due to polarization. The difference between the capacity value measured at a certain magnification and the capacity value measured at the lower magnification mentioned above can be regarded as the capacity change caused by polarization. In the constant-current-constant-voltage (CC-CV) charging and constant-current discharging curves, polarization can be characterized by the ratio of the constant-current charging capacity to the constant-voltage charging capacity in the charging curve. The lower the ratio of constant current charging capacity to total charging capacity or the higher the ratio of constant voltage charging capacity to total charging capacity, the greater the polarization.
In addition, an increase in electrode polarization can be reflected by an increase in the charge/discharge plateau voltage difference in the charge/discharge curve, which is easier to read in a “cyclic” charge/discharge curve. This can be initially recognized by the difference in the longitudinal axis of the charge/discharge curves, such as the charge/discharge curve of the Li-rich cathode material (Li1.2Ni0.13Co0.13Mn0.54O2) in Fig. 4. Compared with the 1st cycle curve, the difference in the longitudinal axis of the 2nd cycle curve is smaller, indicating a decrease in polarization. In addition, this value can also be characterized by the potential difference between the embedded delithium peaks in the differential capacitance curves, and the polarization increases when the potential difference becomes larger.
Analysis of dQ/dV curves
In the process of analyzing the battery charge/discharge curve, in order to facilitate the study of the charge/discharge curve, the curve is differentiated and the plateau region is converted into a peak curve. The commonly used methods to analyze the charge/discharge curve are differential differential capacity curve (dQ/dV vs. V) and differential voltage curve (dV/dQ vs. Q).
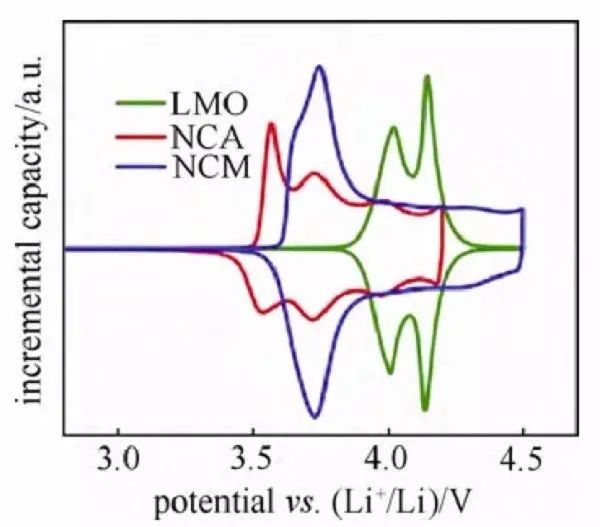
Fig. 5 dQ/dV vs. V curves of half-cells with several cathode materials
Among them, the differential differential capacitance curve, referred to as the IC curve (Fig. 5), is more widely used, but due to the presence of a voltage plateau (i.e., dV = 0), the data should be handled with caution. The oxidation and reduction peaks in the curve correspond to the charging and discharging platforms in the charge-discharge curve and have a correspondence with the oxidation and reduction peaks in the cyclic voltammetry curve. According to the peak positions in the curve, the redox reaction can be confirmed and judged by reference. By differentiating the charge/discharge curves of the same cycle and comparing the peaks, the middle value of the corresponding redox peak potential is the thermodynamic equilibrium potential. In addition, the movement and decay of the peaks also have certain comparative value. For example, the movement of the peak position indicates that the charge/discharge platform potential near the potential is shifted, which is related to the embedding and dislodging of lithium caused by the structural change of the material; the intensity change of a peak position can characterize the change of the charge/discharge platform length of the potential.
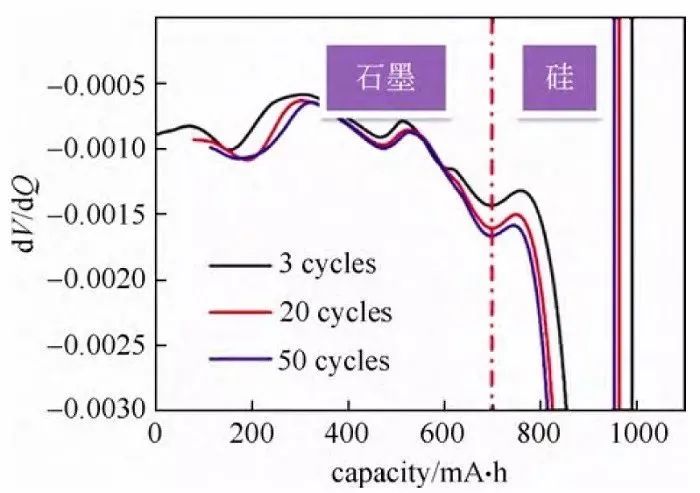
Figure 6
Differential voltage curve, referred to as dV curve, can be based on literature or experimental comparison curve peak attribution, and according to the horizontal coordinate of the peak to initially judge the capacity of different materials or platforms to play the situation, the curve of the data processing is more convenient, and is mostly used in the analysis of hybrid materials electrode sheet. Figure 6 shows the dV curve of the discharge process of the silicon and carbon hybrid material/lithium metal wafer half-cell, and it can be concluded from the comparative analysis that, in the third week of cyclic discharge capacity, the capacity played by the silicon material is 293 mA-h, the capacity played by the graphite is 697.6 mA-h, and the capacity played by the silicon and the graphite are both reduced with the cycle. It should be noted that whether the data of differential capacitance and differential voltage curves are smooth or not has an effect on the voltage measurement precision, current control precision, temperature stability during the test, and the density of sampling points of the charger/discharger.
References:
[1] Wu Yuping, et al. Lithium-ion batteries: application and practice[M].
[2] Wang Qi-Yu, et al. Assembly, charge/discharge measurements and data analysis of lithium-ion button batteries[J].
[3] Wang Qi-Yu, Wang Shuo, Zhang Ji-Nan, et al. Failure analysis of lithium-ion batteries[J].
[4] Zhang Yong, Wu Xingbing, Wang Lizhen, et al. Preparation process of button type lithium ion battery[J].
Due to the limited knowledge and English level is inevitable errors and omissions, if there are errors or infringement of the text, please contact me as soon as possible by private letter, I will immediately be corrected or deleted.
Source:WeChat https://mp.weixin.qq.com/s/Fs2wgoa5PqkSomC9StTS1Q
If you do battery research or battery materials research, you might be interested in these: