
Common Q&A for EIS in Lithium-ion Battery Failure Analysis
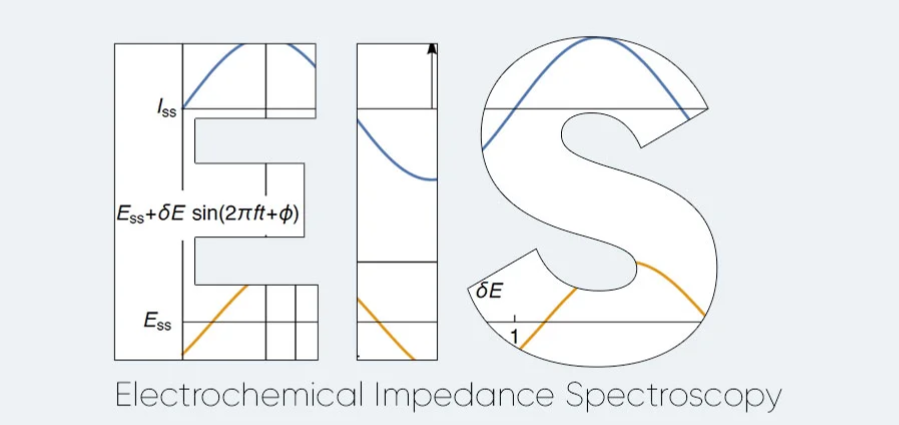
Q1: What are the application scenarios of EIS in lithium-ion batteries?
A1: The application scenarios of EIS can be categorized into the following three areas:
Electrode Material Characterization
Electronic Conductivity Evaluation: Analyze the electronic transport resistance of electrode materials using high-frequency impedance data (e.g., above 10 kHz). For example, if the conductive agent in graphite material is unevenly dispersed, the high-frequency ohmic resistance (Rs) will rise significantly.
Ionic Diffusion Characteristics Research: The slope of the Warburg impedance in the low-frequency region (below 1 Hz) reflects the lithium-ion diffusion coefficient. For instance, silicon-based anodes may show increased diffusion impedance (Zw) due to volume expansion, which limits rate performance.
Interfacial Behavior Analysis
Electrode/Electrolyte Interface (SEI Film): The diameter of the semicircle in the medium-frequency region corresponds to the charge transfer resistance (Rct). A sudden surge in Rct after cycling may indicate the rupture and regeneration of the SEI film (such as the accumulation of LiPF6 decomposition products).
Interlayer Contact in Composite Electrodes: In multi-layer electrodes (such as NCM/graphite full cells), an additional semicircle in the medium-to-high frequency range can reveal the contact resistance at the positive and negative electrode interfaces.
Battery Aging and Failure Diagnosis
Distinguishing Aging Mechanisms:
Loss of Active Lithium: A slow rise in impedance across all frequencies, with a synchronized increase in Rct and Zw (e.g., reversible lithium loss caused by lithium plating on the anode).
Structural Degradation: A sharp drop in the low-frequency Warburg slope (e.g., grain boundary cracks in NCM cathodes hindering ion transport).
Identification of Extreme Failures:
Micro-short Circuits: Abnormal decrease in the high-frequency intercept (Rs) caused by electronic leakage from separator penetration.
Lithium Plating: Distortion of the “diffusion tail” in the low-frequency region (lithium dendrites causing transport heterogeneity).
Q2: How to analyze EIS test results?
A2: EIS data analysis should follow these steps:
1. Data Pre-processing
Eliminate abnormal points, such as outliers caused by instrument noise or poor contact.
Verify consistency with the Kramers-Kronig transform to ensure the data adheres to the linear response assumption.
2. Equivalent Circuit Modeling
Selection of Basic Models:
| System Type | Recommended Equivalent Circuit |
| Simple Half-cell (e.g., Li/Graphite) | Rs – (Rct // CPE) – Zw |
| Full Cell (e.g., NCM/Graphite) | Rs – (Rsei // CPE1) – (Rct // CPE2) |
- Complex Interface Expansion: Connecting multiple R-CPE units in series to simulate the layered structure of SEI/CEI films.
3. Parameter Fitting and Physical Interpretation
Correlation of Key Parameters:
| Parameter | Physical Significance | Typical Abnormal Scenarios |
| Rs | Ohmic Resistance (Electrolyte/Contact) | Sudden surge in Rs → Electrolyte depletion or tab corrosion |
| Rct | Charge Transfer Resistance | Continuous rise in Rct → SEI thickening or active material loss |
| CPE-n | Interface Roughness (0 ≤ n ≤ 1) | n < 0.8 → Accumulation of side-reaction products |
| Zw | Warburg Diffusion Resistance | Decrease in Zw slope → Decline in electrode porosity |
4. Frequency Domain Feature Analysis
High-Frequency Region (>1 kHz): The intercept on the real axis of the Nyquist plot directly corresponds to the ohmic resistance (Rs). It is used to evaluate electrolyte conductivity (for example, at room temperature, 1M LiPF6/EC:DMC electrolyte typically shows Rs ≈ 3-5 Ω·cm²).
Medium-Frequency Region (1 Hz – 1 kHz): The diameter of the semicircle equals the charge transfer resistance (Rct). This parameter is significantly affected by temperature (for example, an Rct of 20 Ω at 25°C may increase to 100 Ω at -20°C).
Low-Frequency Region (<1 Hz): The 45° sloped line reflects bulk diffusion. The reciprocal of the slope is inversely proportional to the diffusion coefficient (D), where the Warburg coefficient (σ) characterizes the resistance to ion transport.
Q3: What is the physical significance of the EIS fitting parameters?
A3: Correspondence between fitting parameters and battery states:
Rs (Ohmic Resistance): Corresponds to the electrolyte and contact resistance.
Failure Analysis: A sudden surge in Rs indicates electrolyte dry-out or tab corrosion. A typical 5% increase after cycling suggests electrolyte consumption, while a sudden drop may indicate a micro-short circuit.
Rct (Charge Transfer Resistance): Represents the resistance to charge transfer at the interface.
Failure Analysis: A continuous rise in Rct indicates SEI thickening or active material loss. For example, a 30% increase every 100 cycles suggests continuous SEI growth.
CPE-n / CPE-Q (Interface Properties): * CPE-n (Dispersion Exponent): Reflects interface roughness (ranging from 0 to 1). A value below 0.8 indicates the accumulation of side-reaction products.
CPE-Q (Interface Capacitance): Represents the interface capacitance. A 50% decrease in the Q value indicates a reduction in active surface area, often due to material pulverization.
Zw (Warburg Diffusion Impedance): Represents the diffusion resistance within the electrode.
Failure Analysis: A decrease in the Warburg slope indicates a decline in electrode porosity. An increase in the slope may suggest pore clogging, such as from binder decomposition.
| Parameter | Physical Significance | Typical Trends & Failure Correlation |
| Rs | Ohmic Resistance (Electrolyte/Contact) | Sudden Surge: Electrolyte dry-out or tab corrosion. +5% Rise: Electrolyte consumption. Sudden Drop: Micro-short circuit. |
| Rct | Charge Transfer Resistance | Continuous Rise: SEI thickening or active material loss. +30% per 100 cycles: Continuous SEI growth. |
| CPE-n | Interface Roughness (0 to 1) | n < 0.8: Accumulation of side-reaction products. |
| CPE-Q | Interface Capacitance | -50% Q value: Active surface area reduction (material pulverization). |
| Zw | Diffusion Resistance | Lower Slope: Decline in electrode porosity. Higher Slope: Pore clogging, such as binder decomposition. |
Q4: How to quickly diagnose battery issues using fitting parameters?
A4: Fast Diagnosis Logic Based on Parameter Correlation
Abnormal Rs
Rs Increase + Normal Rct: Electrolyte dry-out or decrease in salt concentration.
Rs Decrease + Rct Increase: Micro-short circuit caused by local separator melting (e.g., high-temperature abuse).
Correlation between Rct and CPE
Rct Increase + CPE-Q Decrease: Active material peeling (e.g., graphite anode delamination from the copper current collector).
Rct Increase + CPE-n Decrease: Accumulation of interfacial side-reaction products (e.g., manganese ion dissolution and deposition).
Zw Variation Patterns
Zw Slope Increase: Decline in electrode porosity (e.g., damage to the carbon coating layer of an LFP cathode).
Zw Curve Distortion: Lithium dendrite growth (characterized by a “dual-slope” feature in the low-frequency region).
Typical Scenarios:
Poor Low-Temperature Performance: In a -20°C test, if Rct increases from 20 ohms to 80 ohms and the Zw slope doubles, the low-temperature film-forming characteristics of the electrolyte must be optimized.
Cycle Life Degradation: After 100 cycles, if Rct increases by three times and CPE-n is less than 0.7, it indicates a need for additives like VC or FEC to stabilize the SEI.
Q5: How do the different EIS frequency regions correspond to physical battery processes?
A5: Frequency Segment Decomposition and Process Mapping
| Frequency Range | Dominant Process | Nyquist Plot Feature | Typical Failure Correlation |
| > 10 kHz | Ohmic Transport | Real-axis intercept | Poor tab welding (sudden Rs increase) |
| 1-10 kHz | Interface Capacitance Response | High-frequency semicircle (if present) | Current collector corrosion (abnormal CPE-Q) |
| 100-1k Hz | Charge Transfer | Medium-frequency semicircle diameter | SEI thickening (continuous Rct rise) |
| < 100 Hz | Bulk Diffusion | Low-frequency 45-degree sloped line | Electrode pore clogging (Zw slope change) |
Q6: What are some examples of EIS frequency region analysis?
A6: Typical Testing Case Studies
Electrode Material Comparison Experiment
Material A (Single-crystal NCM): The low-frequency slope maintains 45° down to 0.1 Hz, corresponding to a diffusion coefficient (D) of 1×10⁻¹⁰ cm²/s.
Material B (Polycrystalline NCM): The low-frequency slope begins to flatten at 1 Hz, with D = 3×10⁻¹¹ cm²/s, explaining its faster capacity decay.
Temperature Gradient Testing
-20°C Test: Rct increases from 20 Ω at 25°C to 150 Ω, and the Zw slope increases by 3 times; this indicates a need for low-viscosity electrolytes (such as EC-Free formulations).
Cycle Aging Tracking
At 50 cycles: Rct increases from 15 to 25 Ω, and CPE-n decreases from 0.95 to 0.88.
At 200 cycles: Rct reaches 60 Ω, and CPE-n drops to 0.72. SEM (Scanning Electron Microscopy) results show the SEI thickness has increased from 20 nm to 120 nm.
Notes
Testing Specifications: It is recommended to perform tests at 50% State of Charge (SOC) to eliminate concentration polarization interference. Select an amplitude between 5–10 mV to avoid non-linear effects.
Advanced Developments: Combine with DRT (Distribution of Relaxation Times) to resolve multiple relaxation processes, or use in-situ EIS to monitor the dynamic evolution of the SEI.
Neware was founded in 1998. We are trusted by ATL, BYD, CATL, Tesla, Apple, HUAWEI, SolarEdge, etc. We provide battery testing solutions for testing battery cell, module, pack, supercapacitor, BESS, etc. If you want to do capacity, cycle life, pulse, DCIR, GITT, HPPC, or EV driving simulation test, please feel free to contact us.
Due to the limited knowledge and English level is inevitable errors and omissions, if there are errors or infringement of the text, please contact me as soon as possible by private letter, I will immediately be corrected or deleted.