
Design, Assembly, and Testing of Full Coin Cells: Tutorials and Case Studies
1. Introduction of Full Coin Cells
A full cell is a complete battery system comprising a cathode, anode, separator, electrolyte, and casing. Unlike half-cells, full cells provide an accurate assessment of the electrochemical and mechanical performance of a battery under actual operating conditions.
While a half-cell typically utilizes a metal sheet or foil (such as lithium metal) as the counter electrode, a full cell is composed of two active electrodes—one functioning as the cathode and the other as the anode.
The design and assembly of a full cell require the consideration of multiple factors, including the selection of electrode materials, electrolyte types, separator properties, and the structure of the battery casing. These considerations ensure the performance, safety, and reliability of the battery. Full-cell testing is generally used to evaluate the compatibility between the cathode/anode materials and the rest of the battery system, as well as its performance under real-world application conditions.
Based on laboratory full coin cells, this article introduces the design, assembly, and testing of full batteries, and provides a case-based analysis of the factors influencing full-cell design.
2. Overview of Full Coin Cells
2.1 Definition of Full Coin Cells
A full cell refers to a complete battery system equipped with all necessary components, including the cathode, anode, electrolyte, separator, and casing. It is capable of practical electrical energy storage and release, serving as a critical tool for evaluating the performance of battery materials under real-world operating conditions. In a full cell, the cathode and anode materials convert electrical and chemical energy through redox reactions, while the electrolyte and separator are responsible for ion migration and preventing short circuits caused by direct contact between the two electrodes, respectively.
2.2 Working Principle of Full Coin Cells
The working principle of a full cell is based on the redox reactions between the cathode and anode materials. Taking the lithium iron phosphate (LiFePO4) cathode and graphite (C) anode as an example: during charging, the externally applied voltage causes Li⁺ ions to deintercalate from the LiFePO4 and migrate to its surface. Under the continuous influence of the external voltage, these ions enter the electrolyte, pass through the separator, and then move through the electrolyte again to reach the graphite surface, where they finally intercalate into the graphite structure. Simultaneously, electrons travel through the external circuit and rapidly reach the graphite side to maintain the charge balance of the entire battery system, ensuring the charging process proceeds smoothly. During discharging, the direction of Li⁺ movement and the electrochemical reactions are the reverse of the charging process. A schematic diagram of the coin-cell components is shown in Figure 1.
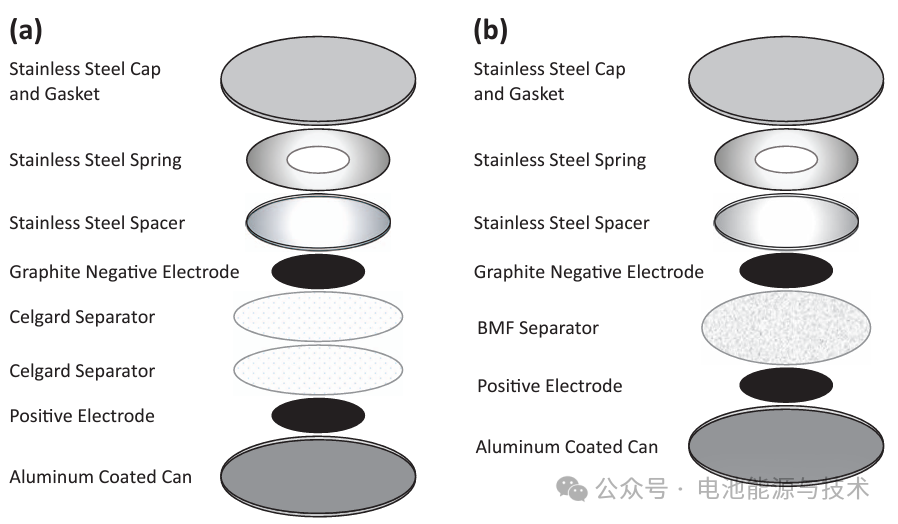
(a) Two Celgard separators and (b) one polypropylene blown microfiber (BMF) separator. (doi: 10.1149/2.1171902jes)
3. Full Coin Cells Design and Assembly
3.1 Design Basis of Full Coin Cells
The design of coin-type full cells primarily considers the N/P ratio, Overhang, and Initial Coulombic Efficiency (ICE). These design criteria are introduced in detail below.
3.1.1 N/P Ratio
1. Definition:
The N/P ratio, also known as CB (Cell Balance), refers to the capacity ratio of the negative electrode material to the positive electrode material directly facing it, measured under the same stage and conditions.
[Note] The N/P ratio typically ranges between 1.05 and 1.20. An excess of negative electrode material is necessary to prevent metal deposition and the resulting dendrite formation. However, from the perspective of energy density and production costs, this excess should be minimized as much as possible. In a laboratory setting, the N/P ratio setting is usually flexible, provided the assembled full cell can achieve stable cycling.
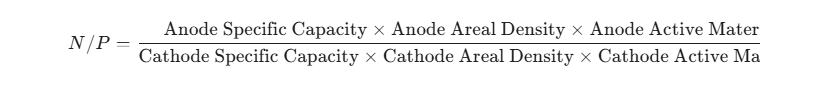
2. Calculation Formula for N/P Ratio:
The N/P ratio is calculated as follows:
[Notes on Calculation]:
(1) Same Stage: Since batteries have distinct charging and discharging processes corresponding to different specific capacities, the results may vary. Therefore, an appropriate process must be selected for the calculation.
(2) Same Conditions: External factors such as test current density, electrolyte type, and test temperature must remain consistent. The actual specific capacities from respective cathode and anode half-cells should be used to avoid discrepancies that could skew the N/P ratio.
(3) Facing Area: This refers to the specific region where the cathode and anode electrode sheets are aligned.
[Technical Tips]:
(1) For laboratory coin-type full cells, it is common practice to use the discharge specific capacity for the cathode material half-cell and the charge specific capacity for the anode material half-cell for calculation purposes.
(2) Issues such as electrode wrinkling or curling can be addressed by reducing the drying rate, lowering the drying temperature, or securing the electrode with tape, depending on the specific situation.
3. Impact of N/P Ratio on Battery Performance:
(1) Excessive N/P Ratio (Large Anode Excess): While this effectively prevents lithium plating, it leads to a decrease in the effective loading of the cathode material, reduced specific capacity utilization, and lower overall energy density.
(2) Insufficient N/P Ratio (Small Anode Excess): This increases the risk of lithium plating during normal cycling or under abuse conditions (e.g., overcharging or over-discharging), which adversely affects battery performance and safety.
3.1.2 Overhang
1. Definition: Overhang refers to the extra portion of the anode relative to the cathode in both length and width directions. The design of the overhang is primarily based on the following considerations:
(1) Prevention of Lithium Dendrites: The anode overhang helps prevent lithium ions from depositing on the anode surface to form lithium dendrites during charging. This reduces the risk of dendrites piercing the separator and causing internal short circuits, thereby enhancing battery safety.
(2) Capacity Maintenance: When the anode area is larger than the cathode area, it ensures there is sufficient space to receive or release lithium ions during the charge-discharge process, maintaining the battery’s capacity.
(3) Impact on Initial Efficiency: An increased anode area in the overhang design may lead to a decrease in initial coulombic efficiency (ICE) and a gradual loss of capacity. This is because some lithium ions diffuse into the excess anode regions (the “dead zones”), affecting the electrochemical performance.
(4) Energy Density Trade-off: While overhang design improves safety and capacity retention, an excessive overhang results in lower energy density because the extra material does not contribute to active energy storage.
2. Design: In a laboratory setting, for circular electrode discs, the overhang is characterized by the difference in surface area. Dimensions in a cell are designed according to the principle: Separator > Anode Disc > Cathode Disc.
For example:
If using a 10 mm (or 12 mm) diameter cathode disc;
One should select a 12 mm (or 14 mm) diameter anode disc;
The separator should be 14 mm (16 mm, or 19 mm) in diameter.
This sizing prevents electrode misalignment, which could lead to rapid capacity decay and battery failure. The specific dimensions selected should be determined based on the particular requirements of the experiment.
3.1.3 Initial Coulombic Efficiency (ICE)
1. Definition The Initial Coulombic Efficiency (ICE) is the ratio of the charge capacity released during the first discharge to the charge capacity input during the first charge. It reflects the energy conversion efficiency of a battery during its initial cycle.
2. Design Considerations During the first charge-discharge cycle, the formation of the Solid Electrolyte Interphase (SEI) layer on the material surface leads to a loss of active ions. This results in a capacity hierarchy where: First Charge Capacity > First Discharge Capacity > Subsequent Discharge Capacity.
Therefore, this discrepancy must be carefully accounted for during the design phase. For laboratory coin-type full cells, two common strategies are used to mitigate the impact of ICE:
Pre-cycling: The cathode and anode are first assembled into separate half-cells and cycled several times. They are then disassembled and reassembled into a full cell once the interfaces have stabilized.
Electrolyte Compensation: Adding an excess amount of electrolyte during full-cell assembly can, to some extent, compensate for the loss of active ions.
3. Prelithiation Methods. Prelithiation is a technique used to enhance the initial coulombic efficiency (ICE) and overall performance of lithium-ion batteries. It involves introducing an additional lithium source into the battery during the manufacturing process to compensate for the irreversible loss of lithium ions caused by the formation of the Solid Electrolyte Interphase (SEI) layer and other side reactions.
Below are several common prelithiation methods:
(1) Chemical Prelithiation: Lithium is introduced onto the surface of the anode material through chemical reactions, such as using a lithium salt solution to react with the anode, allowing lithium ions to intercalate into the material.
(2) Electrochemical Prelithiation: A system is formed using lithium foil, electrolyte, and the anode. By applying an external voltage, lithium ions diffuse through the electrolyte into the anode to complete the prelithiation process.
(3) Contact Prelithiation: Metallic lithium sources are incorporated into the anode material. Prelithiation occurs via the “micro-corrosion” internal short-circuit reaction that happens when the metallic lithium comes into direct contact with the anode material.
(4) Lithium Salt-Assisted Prelithiation: Specific lithium salts are added to the electrolyte. These salts decompose during the first charge, releasing extra lithium ions to replenish the lithium lost during SEI formation.
(5) Surface Coating Prelithiation: The anode material surface is coated with lithium-containing compounds, such as lithium oxides or lithium metal-organic compounds. These compounds decompose and release lithium ions during the initial charge.
(6) Lithium Alloy Prelithiation: Lithium alloys (e.g., Li-Si or Li-Ge alloys) are used as part of the anode material, utilizing the lithium within the alloy to provide an additional lithium source during the first charge.
(7) Spray Coating Prelithiation: A mixture of stabilized lithium metal particles (SLMP) and surfactants is sprayed onto the anode to form a uniform lithium-containing coating, thereby extending the battery’s cycle life.
(8) Mechanical Rolling: A sacrificial lithium film is introduced onto the anode surface via mechanical rolling. This constructs prelithiation interfaces with varying contact states to improve lithium utilization.
(9) Vacuum Thermal Evaporation: This technique is used to deposit a thin lithium film onto the anode surface. The high mobility of lithium vapor enables highly conformal contact and provides abundant electronic pathways.
[Note] The choice of prelithiation technique depends on the battery type, the materials used, and the specific manufacturing processes. By implementing prelithiation, the total capacity, energy density, and cycling stability of the battery can be enhanced, thereby extending its overall service life.
3.1.4 Determination of Voltage Range
The voltage range of a full cell is determined by the difference between the potentials of the positive and negative electrodes. Specifically, it can be defined as the range from the minimum cathode potential minus the maximum anode potential, to the maximum cathode potential minus the minimum anode potential. The larger difference between these values is typically taken to determine the maximum voltage range of the full cell.
A rough estimation of the maximum voltage range can be performed using the following formula: Maximum Voltage Range = Maximum Cathode Potential − Minimum Anode Potential.
However, in practical applications, the charge and discharge cut-off voltages of a battery often vary based on battery design and safety considerations. The entire theoretical voltage range may not be fully utilized, and the design must be optimized according to specific requirements and conditions.
3.2 Assembly of Full Coin Cells
The assembly sequence of a full coin cell is similar to that of a half-cell. The primary difference lies in the necessity of prelithiation of the anode if one wishes to avoid low coulombic efficiency caused by SEI film formation. In a laboratory environment, this can be achieved by first assembling the anode (or cathode) into a half-cell, performing several pre-cycles, disassembling it, and then matching it with a cathode (or a pre-cycled cathode) to assemble the full cell.
Full Coin Cells Cathode Preparation
The cathode material (e.g., LFP or LCO), conductive agent (e.g., Super P or SWCNTs), and binder (PVDF) are mixed uniformly at a mass ratio of 8:1:1 (or 7:2:1). An appropriate amount of NMP is added and mixed again until homogeneous. The resulting slurry is coated onto aluminum foil. The electrode is dried in a blast drying oven until no obvious solvent residue remains on the surface, then transferred to a vacuum oven for further drying. Finally, the cathode is punched or cut to the required dimensions.
Full Coin Cells Anode Preparation
The anode material (e.g., graphite or activated carbon), conductive agent (e.g., Super P or SWCNTs), and binder (CMC & SBR, 1:1 ratio) are mixed at a mass ratio of 7:2:1 or 8:1:1. Deionized water is added as the solvent and mixed uniformly. The slurry is then coated onto copper foil. After drying at room temperature until the surface is free of visible solvent, the electrode is transferred to a vacuum oven. Once dried, it is cut to the required size to obtain the anode electrode.
[Notes]
(1) PVDF can be pre-dissolved in NMP to prepare a solution with a specific mass fraction; similarly, CMC can be pre-dissolved in water to prepare a solution with a specific mass fraction.
(2) The selection and proportion of the conductive agent and binder should be adjusted based on the specific characteristics of the materials used.
(3) Whether the entire electrode sheet should be dried immediately after coating depends on the actual humidity and temperature. The steps mentioned above are for reference only.
Full Coin Cells Assembly Procedure
The assembly sequence can follow the order below (using the CR2032 format as an example): Positive (Cathode) Case → Spacer (15.6 mm × 0.5 mm) → Cathode Disc → Electrolyte → Separator → Electrolyte → Anode Disc → Spacer (15.6 mm × 0.5 mm) → Wave Spring → Negative (Anode) Case.
[Note] The specific assembly order and the selection of spacer thickness may vary depending on individual laboratory habits and specific cell designs.
4. Case Studies of Full Coin Cells
4.1 Introduction to Testing Instrumentation
A NEWARE mA multi-channel battery testing system (as shown in Figure 2) was utilized to conduct galvanostatic charge-discharge (GCD) or you can say constant current charging and discharging tests. These tests are performed to obtain the actual specific capacity of the half coin cells assembled with cathode and anode materials. Subsequently, the design, assembly, and testing of the full cells are carried out based on the calculation methods described above.
![]()
The NEWARE mA multi-channel battery testing system also integrates a wide range of operating modes:
(1) Charging Modes: Constant Current (CC) charging, Constant Voltage (CV) charging, Constant Current Constant Voltage (CCCV) charging, and Constant Power (CP) charging.
(2) Discharging Modes: Constant Current (CC) discharging, Constant Voltage (CV) discharging, Constant Current Constant Voltage (CCCV) discharging, Constant Power (CP) discharging, and Constant Resistance (CR) discharging.
(3) DCIR Testing: Direct Current Internal Resistance testing.
(4) Cycle Testing: Long-term cycling performance evaluation.
(5) Nested Loops: Features a nested loop function, supporting up to 10 layers of nesting.
For more detailed information on testing functions, please consult with NEWARE staff.
4.2 Setting of Test Parameters for Full Coin Cells
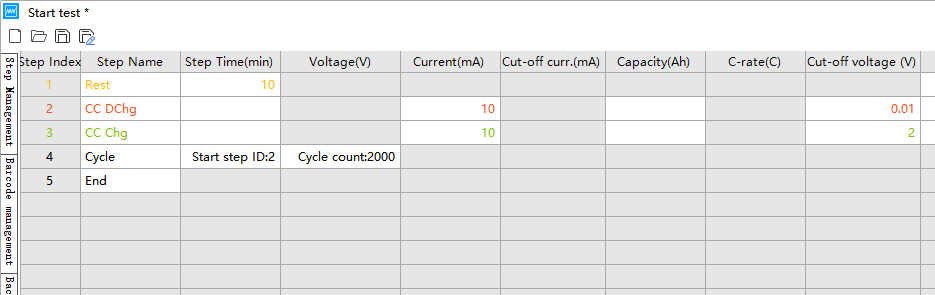
For the test parameter settings, select the Galvanostatic Cycle mode on the NEWARE battery tester; for the C-rate, the Rate Mode can be selected. The parameters can be configured as follows:
Assemble the cathode and anode into separate half-cells according to the pre-calculated N/P ratio. Cycle these half-cells 3 to 5 times within their respective voltage ranges at a current density of 0.1 A g⁻¹ (or lower). Subsequently, disassemble the half-cells inside a glovebox, retrieve the activated cathode and anode electrode sheets, and proceed with full-cell assembly and follow-up testing.
Taking Lithium Iron Phosphate (LFP) as the cathode and Graphite as the anode as an example, the half-cell testing voltage ranges shown in the screenshots below are for reference only.
The specific voltage range should be determined based on the particular properties of the materials used. The following images are for reference only.

4.3 Case Analysis
Taking the assembly of a sodium-ion coin-type full cell using crumpled C-p-MoS₂/CNTs as the anode and Na₃V₂(PO₄)₂F₃ as the cathode as an example, we perform the N/P ratio calculation and battery design. The relevant images and data are sourced from the following SCI publications:
“Crumpling Carbon-Pillared Atomic-Thin Dichalcogenides and CNTs into Elastic Balls as Superior Anodes for Sodium/Potassium-Ion Batteries”
“On-site conversion reaction enables ion-conducting surface on red phosphorus/carbon anode for durable and fast sodium-ion batteries”
In this literature, the C-p-MoS₂/CNTs anode was prepared by mixing the active material, Super P, CMC, and SBR in a mass ratio of 70:15:15 (where CMC:SBR = 1:1). The mixture was coated onto copper foil and vacuum-dried to obtain the electrode. The electrode discs have a diameter of 10 mm with a mass loading of 1.2–1.5 mg cm⁻². The assembled sodium-ion half-cell was tested within a voltage range of 0.01–2.5 V (vs. Na⁺/Na) using an electrolyte composed of 1 M NaClO₄ in EC/PC (1:1, v/v) + 5% FEC. The relevant test data are as follows:
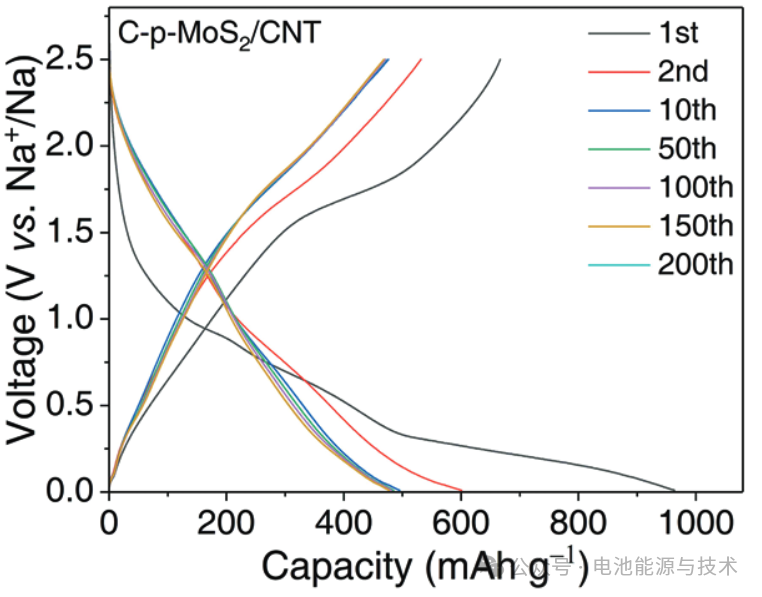
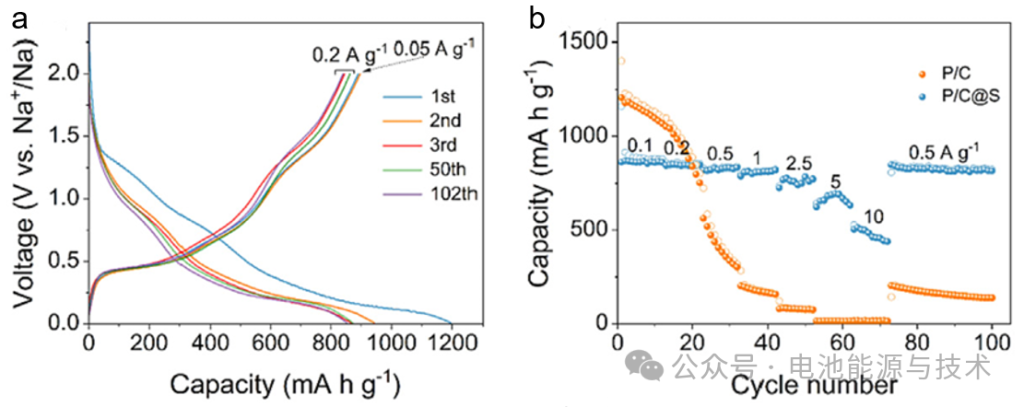
As shown in Figure 5, cycling the C-p-MoS₂/CNTs anode material at a current density of 0.05 A g⁻¹ for the first two cycles facilitates the formation of a uniform and dense SEI film.
The initial discharge specific capacity of this anode material is 963 mAh g⁻¹, with a corresponding charge specific capacity of 666 mAh g⁻¹, resulting in an initial coulombic efficiency (ICE) of 69%. After 200 cycles at a current density of 0.1 A g⁻¹, the capacity remains at approximately 460 mAh g⁻¹.
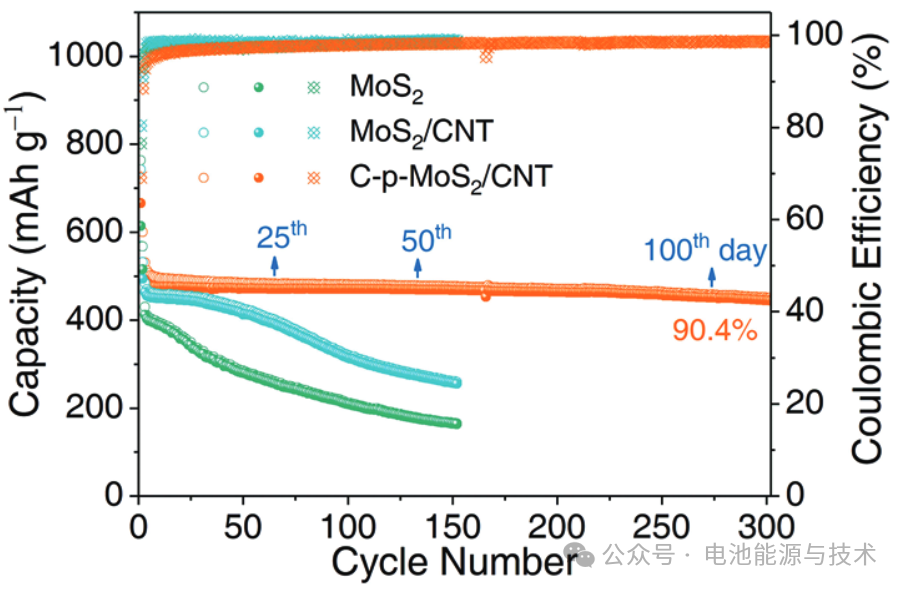
As shown in Figure 6, the C-p-MoS₂/CNT electrode achieves a reversible capacity of 445 mAh g⁻¹ after 300 cycles, indicating its high energy storage capability. The capacity retention rate of the material is 90.4%, which means that the capacity loss is minimal even after numerous charge-discharge cycles, demonstrating excellent cycling stability. Notably, this high capacity retention is achieved under deep charge-discharge testing at a low current density (100 mA g⁻¹) over a period exceeding 100 days. This indicates that the C-p-MoS₂/CNT electrode possesses outstanding long-term cycling performance at low charge-discharge rates.
The preparation of Na₃V₂(PO₄)₂F₃ cathode electrodes involves mixing the active material, Super P, and PVDF in a mass ratio of 8:1:1. The resulting slurry is coated onto aluminum foil and vacuum-dried to obtain the electrode sheets. The electrode discs have a diameter of 10 mm. The electrolyte used is 1 M NaClO₄ in EC/PC (1:1, v/v) + 5% FEC, and the testing voltage range is 2.0–4.5 V (vs. Na⁺/Na). The relevant test data are as follows:
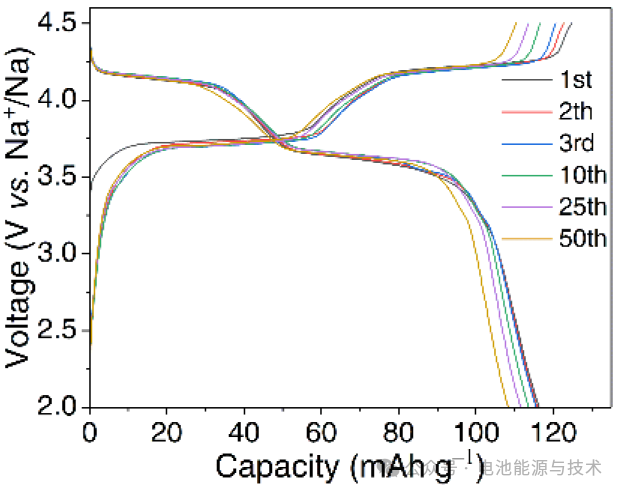
The Na₃V₂(PO₄)₂F₃ cathode material delivers an initial discharge specific capacity of 117 mAh g⁻¹ at 1 C (1 C = 128 mA g⁻¹), exhibiting two distinct discharge plateaus at approximately ~4.1 V and ~3.6 V. The capacity decay during cycling may stem from reduced electrolyte solvent stability at high voltages, structural instability of the material, or side reactions. The electrochemical performance of the cathode material can be improved through carbon coating.
Based on the N/P ratio calculation formula and the specific capacities of the anode and cathode materials, assume the following:
Cathode: Electrode area of 10 mm (diameter), mass loading of 2.4 mg cm⁻², and a capacity of 117 mAh g⁻¹ (calculated at 1 C; it is recommended to use the same current density during actual testing).
Anode: Electrode area of 12 mm (diameter), mass loading of 1.2 mg cm⁻², and a capacity of 445 mAh g⁻¹ (calculated based on the capacity after cycling at 0.1 A g⁻¹).
Therefore:
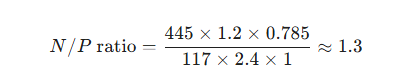
In this formula, the proportion of active material should be calculated based on actual values; for simplicity, the initial proportion of active material is used here as an example. To ensure long-term cycling stability and maximize capacity utilization, the optimized N/P ratio in this work was set to 1.2, with a voltage range of 0.6–3.8 V. The corresponding test data after full-cell assembly are shown in Figure 8.
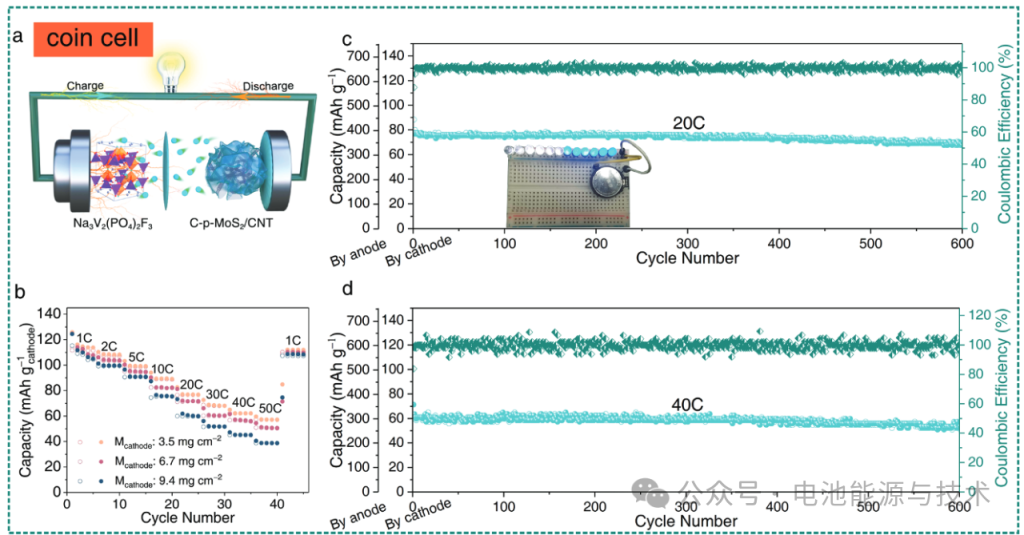
As shown in Figure 8, the full cell operates within a voltage range of 0.8–3.6 V. At a relatively low mass loading of 3.5 mg cm⁻², a high reversible capacity of 59 mAh g⁻¹ (calculated based on the cathode) was achieved at a current density of 50 C ($1\text{ C} = 128\text{ mA g}^{-1}$, based on the cathode). When the mass loading was increased to 9.4 mg cm⁻², the cell still delivered a capacity of 39 mAh g⁻¹ at 50 C. Furthermore, after 600 cycles at a current density of 20 C, it maintained a capacity of 71 mAh g⁻¹, corresponding to a capacity retention rate of 91.5%. Even at a high rate of 40 C, the discharge capacity remained at 52 mAh g⁻¹ after 600 cycles, with a capacity decay rate of only 0.021% per cycle.
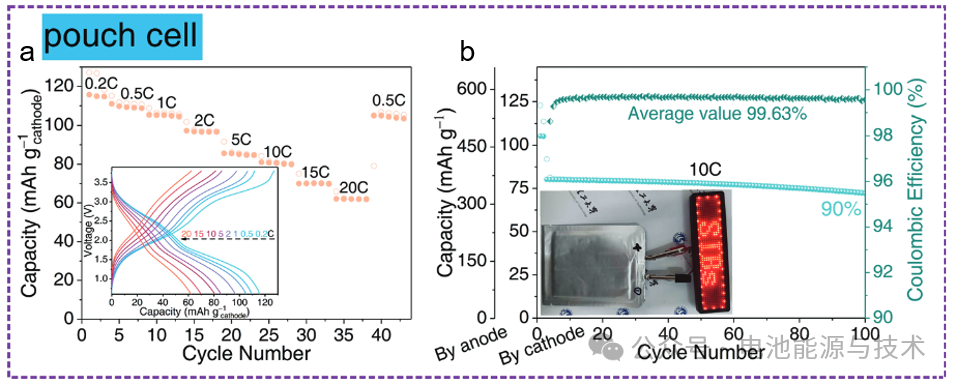
A single-layer pouch cell was assembled using a cathode with dimensions of 5.5 × 4.5 cm², an anode of 6 × 5 cm², and a separator of 6.5 × 5.5 cm². The electrochemical test results are shown in Figure 9. The pouch cell delivers a comparable capacity of 62 mAh g⁻¹ (based on the cathode) at a current density of 20 C. It also maintains 90% of its capacity over 100 cycles at a current density of 10 C, demonstrating the excellent electrochemical performance of the Na₃V₂(PO₄)₂F₃ // C-p-MoS₂/CNT sodium-ion pouch cell.
In literature (2), the P/C@S anode material (as shown in Figure 10) was tested in a half-cell configuration within a voltage range of 0.01–2.0 V. The electrolyte used was 1 M NaClO₄ in EC/PC (1:1, v/v) + 5% FEC. The material exhibited a high capacity of 836 mAh g⁻¹ at a current density of 0.2 A g⁻¹, with an initial coulombic efficiency (ICE) of 74.7% and a capacity retention of 99.3% after 100 cycles. At a current density of 0.1 A g⁻¹, the capacity was 862 mAh g⁻¹.
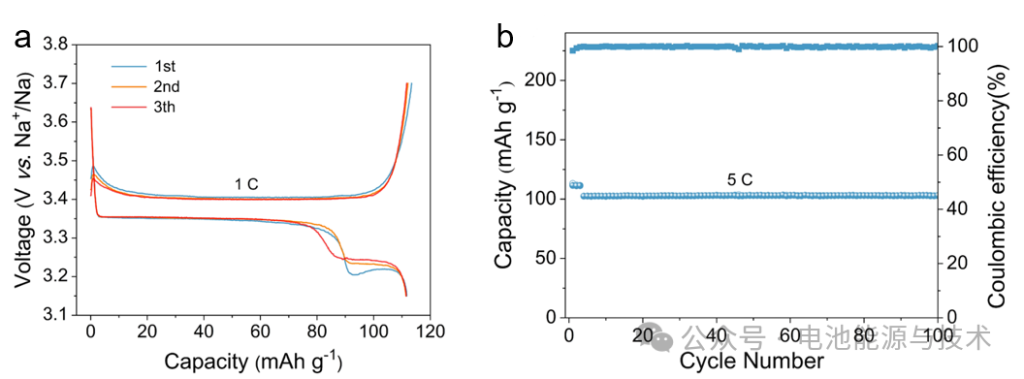
The Na₃V₂(PO₄)₃@C cathode material (as shown in Figure 11) was tested in a half-cell configuration within a voltage range of 3.15–3.7 V. The electrolyte used was 1 M NaClO₄ in EC/PC (1:1, v/v) + 5% FEC. The Na₃V₂(PO₄)₃@C delivers a capacity of ~110 mAh g⁻¹ at a current density of 1 C (1 C = 110 mA g⁻¹), with an initial coulombic efficiency (ICE) of 98.5%. After 100 cycles at 5 C, the capacity remains at approximately ~100 mAh g⁻¹.
Based on the N/P ratio calculation formula and the specific capacities of the anode and cathode materials, assume the following:
Cathode: Electrode area of 10 mm (diameter), mass loading of 2.4 mg cm⁻², and a capacity of 110 mAh g⁻¹ (calculated at 1 C; it is recommended to use the same current density during actual testing).
Anode: Electrode area of 12 mm (diameter), mass loading of 1.0 mg cm⁻², and a capacity of 862 mAh g⁻¹ (calculated based on the capacity after cycling at 0.1 A g⁻¹).
Therefore:

In this formula, the proportion of active material is calculated based on the actual measured values; for simplicity, the initial proportion of active material is used here as an example. To ensure long-term cycling stability and maximize capacity utilization, the optimized N/P ratio in this work was set to 1.15, with a voltage range of 1.2–3.6 V. The corresponding test data after full-cell assembly are shown in Figure 12.
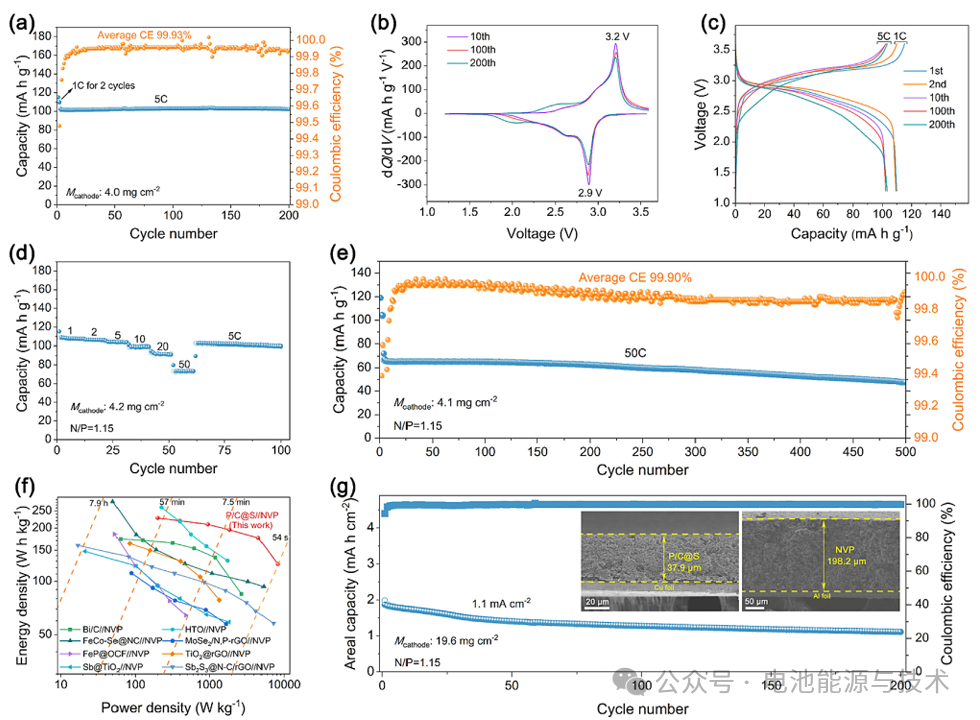
As shown in Figure 12, the P/C@S || NVP full cell, with a cathode mass loading of approximately 4 mg cm⁻², achieves a discharge capacity of about 103 mAh g⁻¹ after 200 cycles at a current density of 5 C, with an average Coulombic efficiency (CE) as high as 99.93%.
Meanwhile, the differential capacity (dQ/dV) curves of the full cell exhibit relatively narrow anodic and cathodic peaks at approximately 3.2 V and 2.9 V, which correspond to the voltage plateaus in the charge-discharge profiles and indicate an average output voltage of ~2.9 V. At a high current density of 50 C, the full cell retains 67.8% of its 1 C capacity (73 mAh g⁻¹). Over 500 cycles at 50 C, the capacity decay rate is only 0.056% per cycle, with an average Coulombic efficiency of 99.90%.
Practical sodium-ion batteries (SIBs) require stable operation under high areal capacity conditions. By increasing the areal mass loading of the active material, the proportion of current collectors, separators, and packaging components in the battery device can be minimized, thereby enhancing the energy density. However, it is quite challenging in a full-cell configuration to achieve high mass loading for alloy-type anode materials, which typically exhibit significant volume effects and unstable electrode/electrolyte interfaces. Consequently, by increasing the cathode loading to 19.6 mg cm⁻² with an N/P ratio of ~1.1, the full cell achieves a high areal capacity of 1.9 mAh cm⁻² and maintains 1.1 mAh cm⁻² after 200 cycles at 1.1 mA cm⁻².
The N/P ratio of a full cell is a critical parameter for ensuring battery performance and safety. An appropriate N/P ratio balances the ion flux between the cathode and anode, preventing anode overloading and metal plating (e.g., sodium or lithium plating), thereby extending battery life and mitigating safety risks.
Ideally, the N/P ratio should be optimized based on the application requirements, electrode material characteristics, and cost-effectiveness. Empirically, while a higher N/P ratio can enhance safety, it may lead to material waste and increased costs. Therefore, in battery design, the optimal N/P ratio must be determined through experimental validation to achieve a balance between performance, safety, and economic feasibility.
Due to the limited knowledge and English level is inevitable errors and omissions, if there are errors or infringement of the text, please contact me as soon as possible by private letter, I will immediately be corrected or deleted.
Source: Battery energy and technology