
About fast charging, how do the batteries in Xiaomi phones, Apple phones, and Tesla electric vehicles achieve fast charging? You’ll find out if you keep reading.
With the widespread application of lithium-ion batteries in electric vehicles, portable devices, and energy storage systems, there is a growing demand for faster and more convenient charging experiences. However, high-rate fast charging significantly increases the electrochemical load on electrode materials, accelerating various aging mechanisms such as lithium deposition, structural degradation, and thermal runaway, thus affecting battery performance, safety, and lifespan. Therefore, developing charging protocols that achieve both fast charging and stable electrochemical and thermal management has become a key challenge in current battery research and industrialization.
Commonly used standardized charging protocols include constant current-constant voltage (CC-CV), multi-stage constant current (MCC), boost charging, pulse charging, and constant power (CP). However, these protocols are only typical conceptual forms. In real-world applications, commercial products typically add more complex hardware and software controls on top of these basic mechanisms to balance speed, efficiency, and safety. Here, we analyze several practical cases, including two commercial smartphones (Figures 1c and 1d) and several electric vehicles (Figure 1e). First, we monitored the current, voltage, and charging power changes of two randomly selected smartphones, the Xiaomi Redmi Note 12 and the Apple iPhone 16 Pro, during their respective charging processes.
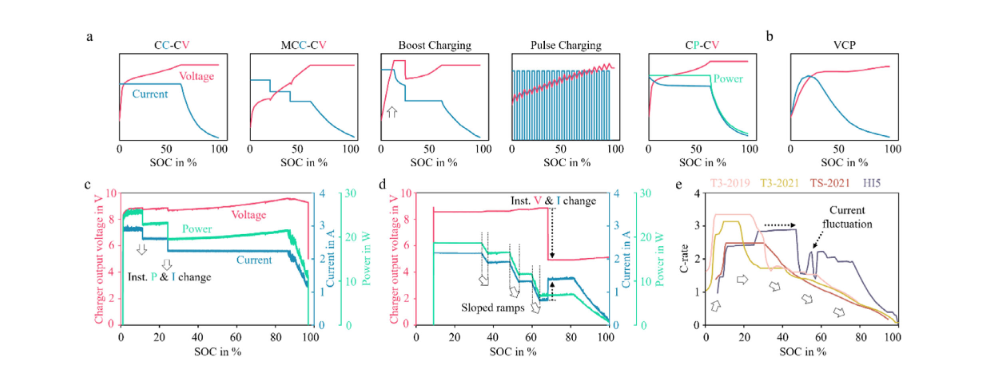
Schematic illustrations of a few common LIBs charging protocols, including a) Constant Current-Constant Voltage (CC-CV), Multistage
Constant Current-Constant Voltage (MCC-CV), Boost Charging, and Pulse Charging, and b) Constant Power-Constant Voltage (CP-CV) and Variable
Current Profile (VCP). c) The charging protocol adopted by a Xiaomi Redmi Note 12 smartphone. d) The charging protocol adopted by an Apple iPhone 16
Pro smartphone. e) The charging protocols used by a few electric vehicles: Tesla Model 3 LR AWD 2019 (T3-2019), Tesla Model 3 LR AWD 2021 (T3-2021),
Tesla Model S Plaid 2021 (TS-2021), and Hyundai Ioniq 5 (HI5). Replotted from data reported by Inside EVs [28]. Accessed October 2025.
Data shows that both smartphone devices employ multiple constant current (CC) stages, entering a gradual current decrease phase as the battery approaches full charge. Despite these commonalities, significant differences exist between the two scenarios. First, the transition between adjacent CC stages in Figure 1c is instantaneous, while Figure 1d shows a gradual current ramp. Second, the externally applied charging voltage (approximately 9 V), representing the adapter output, is significantly higher than the cell-level voltage (3.7–4.2 V), which is regulated by internal power management circuitry during the initial charging phase. As the state of charge (SOC) reaches a preset threshold, a noticeable voltage drop is observed. In Figure 1c, this voltage change occurs later in the charging process, while in Figure 1d it appears around approximately 70% SOC. Notably, this voltage drop in Figure 1d is accompanied by a momentary current increase, as the charging power remains constant within the approximately 65%–80% SOC range. Unlike large battery systems, smartphone batteries do not exhibit a significant current ramp-up in the low SOC range due to their small capacity, low operating voltage, and rapid electronic regulation mechanisms. Power management integrated circuits (PMICs) effectively bypass the need for a gradual electrochemical activation phase by stabilizing voltage and current within milliseconds through soft-start control.
In contrast, complexity increases significantly in larger systems such as electric vehicles. The energy capacity and voltage of electric vehicle battery packs are far higher than those of smartphone batteries, necessitating a controlled current ramp-up at the initial charging stage to suppress transient overpotentials, balance inter-module voltages, and allow the battery management system sufficient time to check cell status before entering the high-current range. At the materials level, this behavior is also closely related to the low lithium-ion diffusion rate and sluggish interfacial kinetics of electrode materials near full discharge. As shown in Figure 1e, electrochemical and systems engineering factors jointly lead to a current ramp-up phase at the beginning of charging, followed by high-rate charging (approximately 2C–3C) up to about 30–40% SOC, and finally a gradual current decay as SOC increases.
One exception is the modern Ioniq 5 (HI5), whose high-rate charging range is extended to approximately 50% SOC. Corresponding to this wider high-power window, the HI5’s average rate of charge is approximately 2.2 C in the 20–80% SOC range, significantly higher than Tesla’s 1.3–1.5 C. While high-current charging can significantly improve energy replenishment speed, it also enhances polarization, heat generation, and reaction inhomogeneity. To mitigate these effects, the HI5 introduces a pulsed constant-current-constant-current (PC-CC) strategy at 47%–58% SOC. This fluctuation-based regulation provides brief rest intervals, which help redistribute lithium ions and achieve thermal equalization in the electrodes, thereby reducing concentration polarization and suppressing local overpotential accumulation, ultimately reducing heat buildup and improving charging consistency within the cell. After the PCCC stage, the HI5 enters a series of short constant-current stages, gradually reducing the current as it approaches full charge.
These examples demonstrate that designing efficient fast-charging protocols requires a high degree of complexity and flexibility. To achieve optimal performance, it is essential to have a deep understanding of the multi-scale coupled reaction mechanisms that occur during charging, including material properties, lithium-ion diffusion kinetics, and the impact of polarization/reaction heterogeneity and thermal effects brought about by high-rate charging on the overall battery behavior.
Figure 2 summarizes the evolution of key physicochemical properties of electrode materials under different SOC conditions, providing a material-level basis for understanding the electrochemical limitations that occur during fast charging. For the NMC cathode (Figure 2a), the c-axis first expands and then contracts during charging, while the a-axis continuously shortens, leading to highly nonlinear lattice strain and volume shrinkage, which significantly exacerbates structural instability in the high SOC range. For the graphite anode (Figure 2b), its volume gradually expands with increasing x in LiₓC₆, and significant interlayer spacing changes occur near the Stage 2–Stage 1 transition, reflecting staged lithium intercalation behavior. The lithium diffusion coefficients of both the cathode and anode exhibit SOC dependence (Figures 2c and 2d): at low SOC, diffusion is slow due to insufficient vacancies, while at high SOC, it decreases significantly due to lattice shrinkage or enhanced Li–Li repulsion, resulting in significantly limited SOC kinetics at both ends. Meanwhile, as the state of charge (SOC) increases, the ohmic resistance of the battery rises sharply (Figure 2e), and the thermal stability of the high-nickel NMC cathode and the high-silicon Si–C anode also deteriorates significantly (Figure 2f). These SOC-dependent structural evolutions, diffusion kinetics, and thermal behaviors collectively determine the design logic in practical fast charging protocols that the current must slowly increase at low SOC and rapidly decrease at high SOC.
![FIGURE 2 a) Changes in the unit cell volume, the c and a lattice parameters of NMC811 at various SOCs during the first charge. Reproduced with permission [45]. Copyright 2019, ACS Publications. b) Changes in the unit cell volume, the interlayer spacing dc-c and the a-axis of graphite versus thelithium content. Reproduced with permission [46]. Copyright 2018, ACS Publications. c) Variation of the lithium diffusion coefficient, 𝐷𝐿𝑖+ , of NMC811,NMC532, and NMC111 as a function of the SOC. Reproduced with permission [47]. Copyright 2020, RSC. Reproduced with permission [50]. Copyright2012, Elsevier. Reproduced with permission [51]. Copyright 2013, Elsevier. d) The lithium diffusivity for the Stage 2 (dark blue squares) and Stage 1 (lightblue circles) phases in the Li-graphite system, derived from kinetic Monte Carlo simulations. Reproduced with permission [52]. Copyright 1996, Elsevier.e) Battery internal Ohmic resistance at various SOC. Reproduced with permission [53]. Copyright 2015, Wiley. f) Thermal stabilities of Ni-rich NMC cathode and Si-rich Si-C anode at different SOCs. Reproduced with permission [54]. Copyright 2020, Wiley.](https://www.newarebts.net/wp-content/uploads/2-14.png)
Figure 3 illustrates multi-scale evidence of electrode polarization and reaction inhomogeneity under fast charging conditions. For LFP and graphite half-cells, the voltage difference between their charge-discharge curves increases significantly as the charging rate increases from 0.1C to 1C or 3C (Figure 3a, b), reflecting that concentration polarization and electrochemical polarization are enhanced with current density. In the GITT test of the full cell (Figure 3c), the pulse current triggers an instantaneous iR voltage jump, which then rises slowly and gradually falls back during the rest period, revealing a resolvable voltage evolution caused by diffusion limitation. The polarization effect at the structural level can be further observed through advanced imaging: X-ray nano tomography shows a significant damage gradient in the electrode depth direction of NMC cathode particles (Figure 3d), indicating that uneven local current distribution at high rates induces particle-scale structural degradation; while operando optical microscopy reveals that the stratified lithium intercalation front of the graphite anode advances from the separator side to the current collector side during fast charging (Figure 3e), forming a significant SOC gradient. These results collectively demonstrate that fast charging significantly exacerbates the reaction heterogeneity within the electrode, leading to the coexistence of local overcharging and undercharging, and amplifies the kinetic constraints related to lithium diffusion, interfacial transport, and phase transitions, providing crucial evidence for understanding and optimizing fast charging protocols.
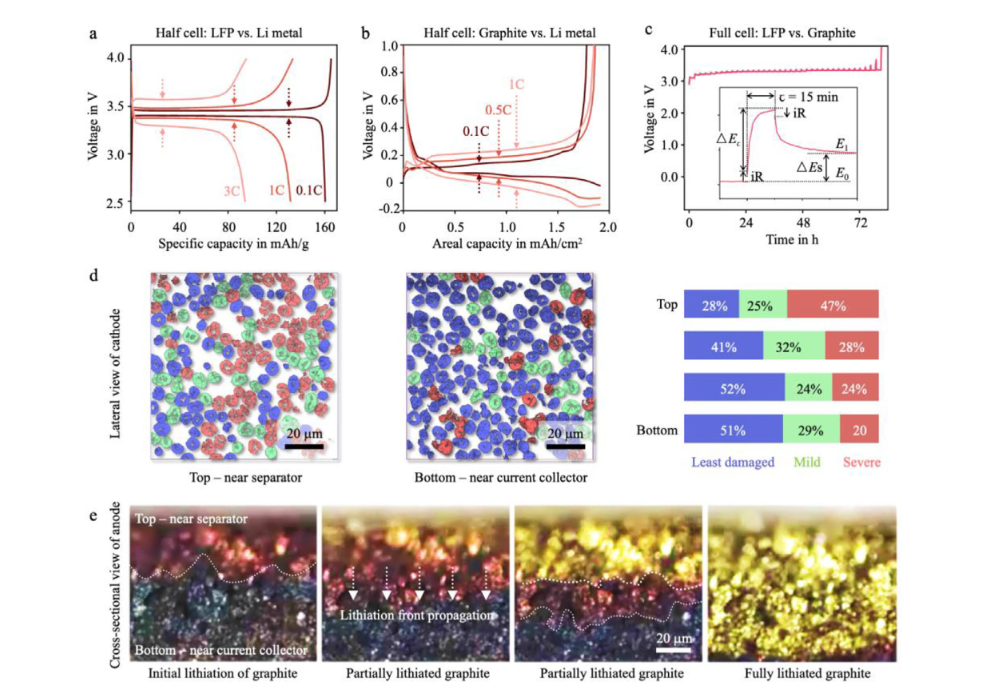
Electrochemical polarization in battery electrodes and cells. a) Half-cell (LFP vs. Li metal) cycling data at various C-rates. b) Half-cell (graphite vs. Li metal) cycling data at various C-rates. c) Full-cell (LFP vs. graphite) GITT data, with an inset illustrating the voltage evolution during a titration step. d) Depth-dependent cathode damage profile revealed by X-ray nano-tomography, inferring the polarization in NMC cathode electrode. e) Depth-dependent anode SOC evolution revealed by operando optical microscopy, inferring the polarization in graphite anode electrode.
Figure 4 illustrates the typical evolution of battery temperature with SOC under different charging protocols, reflecting the strong protocol dependence of heat generation under fast charging conditions. For 18650 cylindrical batteries, standard CC-CV charging (Figure 4a) shows a significant temperature rise during the constant current phase due to the high current, followed by a noticeable temperature drop after entering the constant voltage current decay phase. Pulse charging (Figure 4b) generates periodic temperature rises during high current pulses, with the overall highest temperature also occurring at the end of the pulse phase. The Boost charging protocol (Figure 4c) experiences a rapid temperature rise in the early stages due to the application of extremely high initial current at low SOC, followed by a secondary stable plateau after the current decreases, and then a decrease with current decay in the final CV phase. In contrast, smartphone cells (Figure 4d) experience continuous high power input during multi-stage MCC charging, with temperature accumulating until the final current decay phase before starting to decrease. Overall, these results indicate that cell temperature is almost entirely determined by instantaneous charging current, while high SOC, kinetic limitations, and cumulative energization amplify heat generation, making thermal management a key consideration in fast charging protocol design.
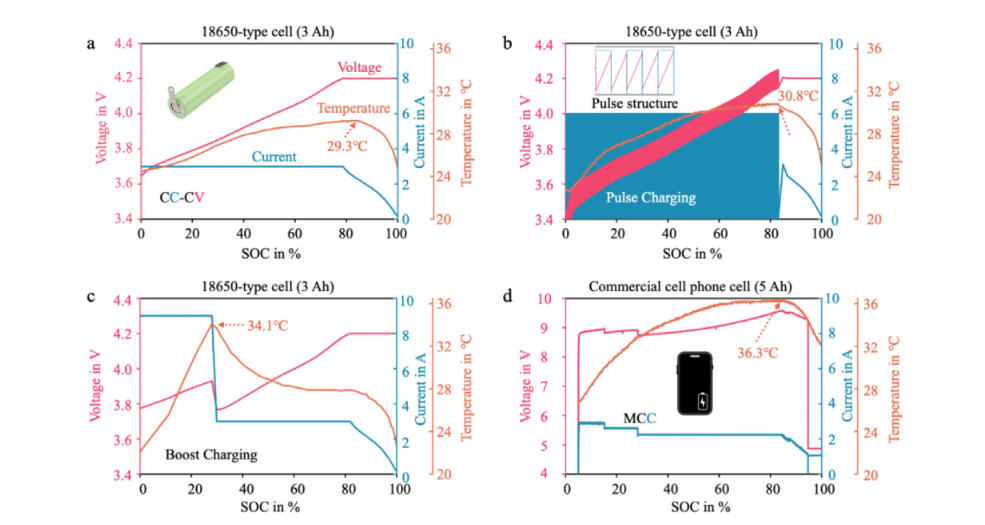
Illustrative measurements of battery temperature evolution under different charging protocols. a) 1C CC–CV for a newly purchased commercial 18650-type NMC–graphite lithium-ion cell (nominal capacity 3.0 Ah, nominal voltage 3.6 V, unused), b) 1C pulse charging (2C current, alternating 1 s charging with 1 s rest) followed by CV for the same type of cell, c) 1C boost charging with CV for the same type of cell, and d) a commercial Xiaomi Redmi Note 12 smartphone (built-in 5.0 Ah cell) charged with a 33 W charger. Temperature was monitored at the cell surface using a thermocouple.
Figure 5 compares the typical operating characteristics of batteries in laboratory testing and real-world electric vehicle operating environments. Under laboratory conditions (Figure 5a), batteries typically follow standardized CC-CV charging and CC discharging cycles, with highly controllable changes in current, voltage, and temperature; simultaneously, the ambient temperature is strictly maintained at a constant level (Figure 5b), thus eliminating the influence of external temperature fluctuations. In contrast, the battery pack log data from a real-world electric vehicle (Figure 5c) exhibits dramatic fluctuations in voltage and current over time, reflecting continuous disturbances from dynamic operating conditions such as acceleration, braking, and energy recovery. The corresponding temperature data (Figure 5d) also shows complex multi-source variations: both ambient and cabin temperatures fluctuate continuously, with significant differences between them. This unsteady load and multi-dimensional temperature variation in real-world usage scenarios contrasts sharply with the stability of laboratory conditions, highlighting the necessity of developing more robust and adaptive charging protocols and thermal management strategies for practical applications.
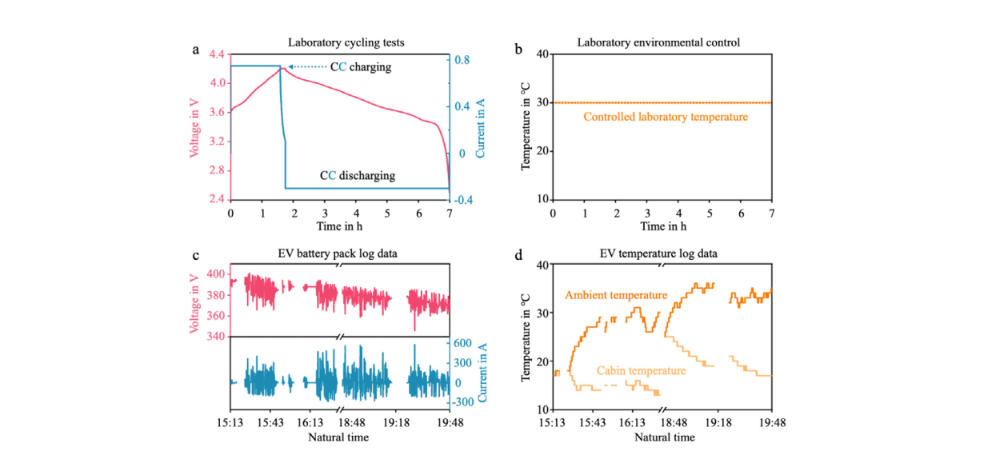
Laboratory controlled battery duty cycle and the duty cycles in electric vehicle in real-world service. a) A standard CC-CV charging and CC discharging duty cycle for a newly purchased commercial 18650-type NMC–graphite lithium-ion cell (nominal capacity 1.5 Ah, nominal voltage 3.6 V, unused). b) The corresponding temperature duty cycle under controlled laboratory environment. c) The voltage and current log data of an EV in real-world service. d) The corresponding temperature log data from this EV.
Figure 6 presents a multi-dimensional fast-charging mechanism analysis framework, outlining the key factors influencing charging protocol design. Material-level crystal structure and phase transition behavior (Figure 6a), electrochemical kinetic processes such as interfacial reactions and ion migration (Figure 6b), and heat generation and accumulation caused by polarization and transport constraints (Figure 6c) collectively determine the battery’s tolerable charging rate at different states of charge (SOC). Based on these mechanistic constraints, practical fast-charging protocols (Figure 6d) must achieve a dynamic balance between current, voltage, and SOC. Multiphysics models (Figure 6e) provide a quantitative description of the electrochemical, thermal, and mechanical coupling behavior, while data-driven methods (Figure 6f) further support protocol optimization, real-time prediction, and adaptive control. Simultaneously, advanced characterization and sensing technologies (Figure 6g) can capture structural evolution, transport behavior, and thermal response at the material, particle, and full-cell scales, providing crucial experimental evidence for verifying mechanisms and guiding protocol design. Overall, this framework emphasizes the need for synergistic integration of materials, models, data, and characterization in fast-charging technology to achieve safe, efficient, and intelligent charging strategies.
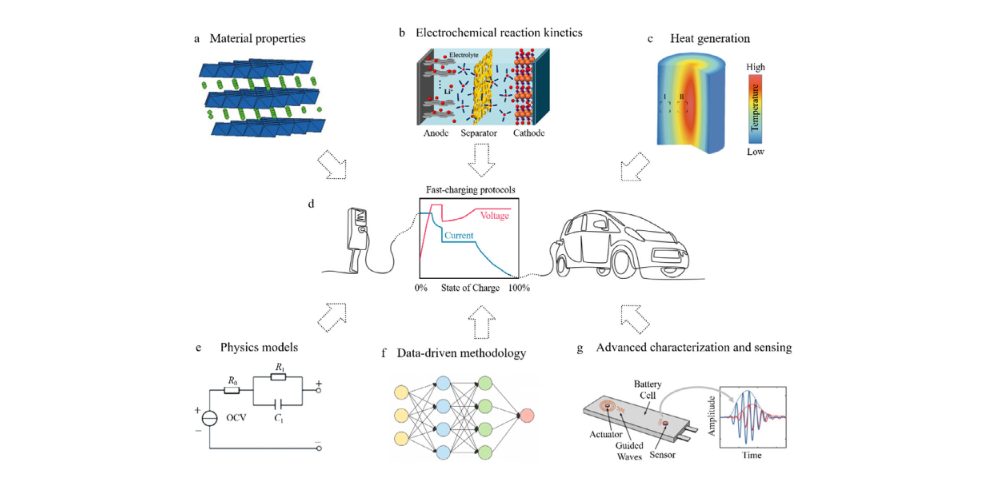
Comprehensive framework for smart fast charging technologies.
From: Li, W.; Yanyachi, A.; Xia, J.; Kuppan, S.; Zhou, J.; Wang, Y.; Li, Y.; Pianetta, P.; Zhao, K.; Mitlin, D.; Ezekoye, O.; Xiao, J.; Wang, J.; Liu, Y., Mechanistic Considerations for Battery Charging Protocol Design. Adv. Energy Mater. 2025. doi.org/10.1002/aenm.202504499