
How to analyze the OCV curve of an LFP battery?
The Open Circuit Voltage (OCV) method is one of the primary techniques used to estimate a battery’s State of Charge (SOC). Consequently, investigating the SOC-OCV curves of Lithium Iron Phosphate (LFP) batteries is of great importance. Current research focuses predominantly on the precise calibration of SOC-OCV curves and the exploration of specific influencing factors. However, there are few reports regarding the effects of active materials, capacity fade, silicon doping, and lithium supplementation on OCV curves. Furthermore, there is a lack of explanation concerning the cause of the voltage step near 60% SOC in LFP/graphite batteries, as well as the relationship between the curve’s shape and the specific characteristics of the LFP and graphite electrodes.
The OCV curve of an LFP/graphite battery is formed by the combined effects of lithium-ion intercalation and de-intercalation at both the cathode and anode. Based on data accumulated by our research group, this paper provides a detailed summary of the impacts of LFP and graphite active materials, battery form factors (prismatic vs. pouch), SOC adjustment direction, rest time after SOC adjustment, capacity fade (storage and cycling), anode silicon doping, and pre-lithiation on the SOC-OCV curve.
1 Experimental Section
1.1 Experimental Batteries
The Lithium Iron Phosphate (LFP) batteries used in this experiment include both polymer pouch cells and prismatic aluminum-shell power cells.
The polymer pouch cells have dimensions of 3.0 mm × 62 mm × 85 mm with a capacity of approximately 2.2 Ah.
The prismatic aluminum-shell power cells measure 60 mm × 220 mm × 112 mm with a capacity of 172 Ah.
1.2 Performance Testing
The measurement method for the SOC-OCV curves of the LFP/Gr (graphite) batteries is shown in Figure 1. The current used to adjust the State of Charge (SOC) was 0.33C. Depending on whether the SOC was adjusted via charging or discharging, the curves are categorized as Charging SOC-OCV curves or Discharging SOC-OCV curves, respectively. Unless otherwise specified, the batteries were left to stand for 4 hours for depolarization after each SOC adjustment, allowing the OCV to reach a relatively stable state.
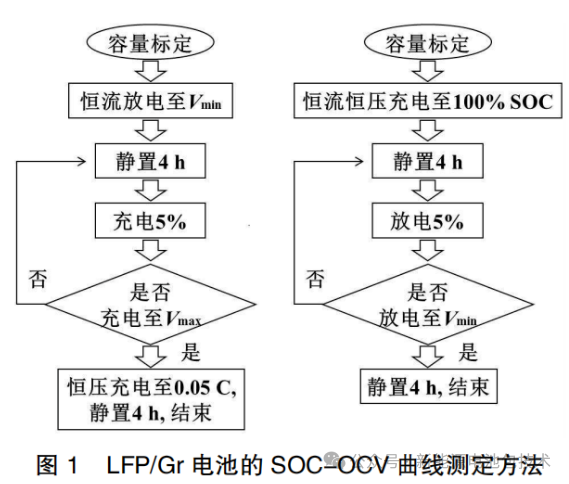
Figure 1: Measurement Method for SOC-OCV Curves of LFP/Gr Batteries
This flowchart illustrates the systematic experimental procedure for calibrating the Open Circuit Voltage (OCV) relative to the State of Charge (SOC), divided into two main processes: the Charging OCV Measurement (left) and the Discharging OCV Measurement (right).
1. Charging SOC-OCV Measurement (Left Flow)
Capacity Calibration (容量标定): The process begins with standard capacity measurement.
Constant Current Discharge to Vmin: The battery is discharged to its lower voltage limit.
Rest for 4 hours (静置 4h): A standing period is required to eliminate polarization and reach a stable equilibrium potential.
Charge 5% (充电 5%): The battery is charged in 5% SOC increments.
Decision Node (Whether charged to Vmax: The loop continues until the upper voltage limit Vmax is reached.
Final Step: Once Vmax is reached, the cell undergoes constant voltage (CV) charging until the current drops to 0.05C, followed by a final 4-hour rest to complete the test.
2. Discharging SOC-OCV Measurement (Right Flow)
Capacity Calibration: Standard capacity measurement.
CC-CV Charge to 100% SOC: The battery is fully charged using the Constant Current-Constant Voltage method.
Rest for 4 hours: To ensure the OCV is stable before measurements begin.
Discharge 5% (放电 5%): The battery is discharged in 5% SOC increments.
Decision Node (Whether discharged to Vmin: The loop continues until the lower voltage limit Vmin is reached.
Final Step: After reaching Vmin, a final 4-hour rest is performed, and the test concludes.
2 Results and Analysis
2.1 SOC-OCV Curves of LFP/Gr Batteries
The SOC-OCV curve of an LFP/Gr battery is the combined result of the electrochemical behaviors of the Lithium Iron Phosphate (LFP) cathode and the Graphite (Gr) anode at corresponding SOC levels. As the SOC increases:
The LFP undergoes progressive de-lithiation, transitioning toward the iron phosphate (FePO4) phase.
Simultaneously, the Gr undergoes progressive lithium intercalation, transitioning through various graphite intercalation compounds (GICs)—such as LiC36, LiC24, and LiC12—before eventually reaching the LiC6 phase.
The SOC-OCV curve serves as a macroscopic manifestation of these phase transitions occurring during the extraction and insertion of lithium ions at the positive and negative electrodes.
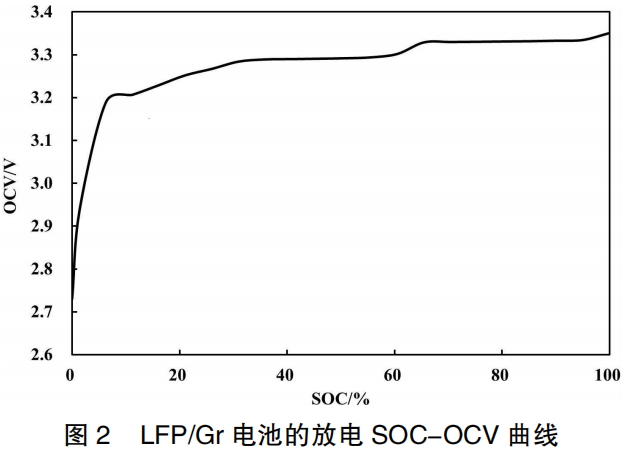
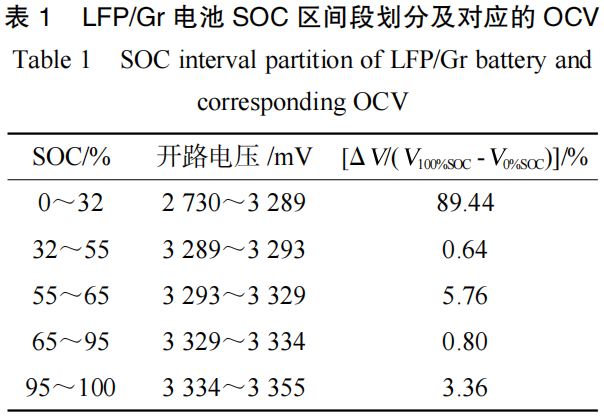
As shown in Figure 2 and Table 1, when the LFP/Gr pouch cell is charged from 0% SOC (empty) to 100% SOC (full), the OCV increases from 2,730 mV to 3,355 mV, representing a total increase of 625 mV. The SOC-OCV curve of the LFP/Gr pouch cell can be divided into five distinct stages:
0%–32% SOC: The OCV changes significantly, increasing by 559 mV, which accounts for 89.44% of the total OCV variation across the 0%–100% SOC range.
32%–55% SOC: The OCV enters its first voltage plateau, showing minimal change with an increase of only 4 mV (accounting for 0.64%).
55%–65% SOC: A voltage step occurs in the OCV, resulting in a larger variation with an increase of 36 mV (accounting for 5.76%).
65%–95% SOC: The OCV remains at the second voltage plateau, with a small increase of only 5 mV (accounting for 0.80%).
95%–100% SOC: The OCV increases by 21 mV (accounting for 3.36%).
2.2 Influence of Active Materials
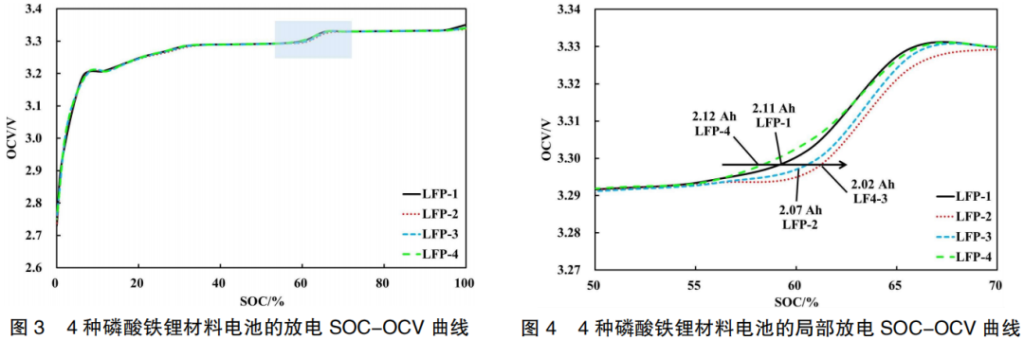
The physical property data of four types of Lithium Iron Phosphate (LFP-1, LFP-2, LFP-3, and LFP-4) are shown in Table 2. The capacity performance of LFP materials is influenced by factors such as carbon content, specific surface area (SSA), and particle size distribution. The capacities of the batteries fabricated with these four materials are 2.11 Ah, 2.02 Ah, 2.07 Ah, and 2.12 Ah, respectively. Their corresponding discharge SOC-OCV curves are illustrated in Figure 3.
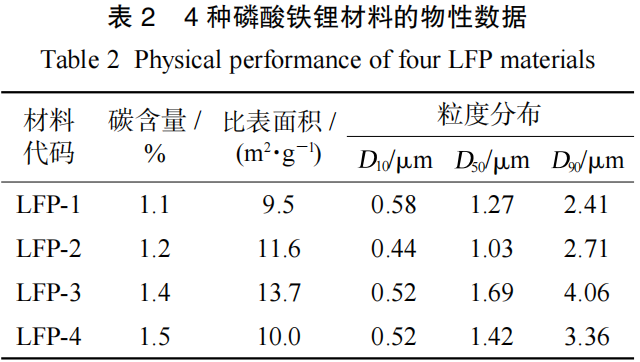
As shown in Figure 3, the four types of materials have little impact on the overall SOC-OCV curves. This is because the OCV is inherently related to the intrinsic characteristics of the Lithium Iron Phosphate (LFP) material itself and is less dependent on the specific manufacturer.
However, looking at the localized curves in the 50%–70% SOC range (Figure 4), it can be observed that at the OCV voltage step, the curves shift from left to right in the following order: LFP-4 → LFP-1 → LFP-3 → LFP-2. This is due to the fact that material parameters vary across different manufacturers, leading to differences in lithium-ion de-intercalation characteristics and specific capacity utilization. Based on the discharge capacities at 25°C and 0.33C, a clear correlation exists between the OCV curve and battery capacity: LFP-4 (2.12 Ah) → LFP-1 (2.11 Ah) → LFP-3 (2.07 Ah) → LFP-2 (2.02 Ah). In other words, as the specific capacity utilization of the LFP active material decreases, the SOC-OCV curve shifts to the right.
In a battery, the graphite active material in the anode also influences the overall capacity. Therefore, the discharge SOC-OCV curves of pouch cells were compared, using the graphite type as the single variable.
As shown in Figure 5, different graphite materials (Gr-1, Gr-2, Gr-3, and Gr-4) also affect the OCV curve within the 50%–70% SOC range. At the OCV voltage step, the curves shift from left to right in the following sequence: Gr-2 → Gr-4 → Gr-3 → Gr-1. This trend consistently correlates with the battery capacities (Figure 6): Gr-2 (2.21 Ah) → Gr-4 (2.20 Ah) → Gr-3 (2.19 Ah) → Gr-1 (2.11 Ah).
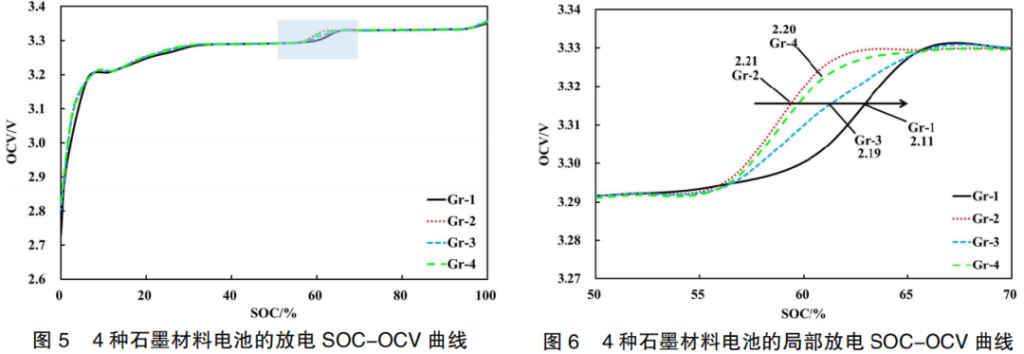
The battery capacity reflects the quantity of lithium ions de-intercalated from the LFP material and intercalated into the graphite material. Consequently, variations in capacity lead to differences in the phase states of the active materials, which in turn affect the potentials of the positive and negative electrodes. This results in varying OCV values for batteries at the same SOC.
Furthermore, within the 50%–70% SOC range, a voltage step (jump) occurs regardless of the specific variations in LFP or graphite materials. This indicates that the voltage step is an intrinsic characteristic of the LFP/Gr battery system.
Charging and discharging your batteries
2.3 Battery Type and SOC Adjustment Direction
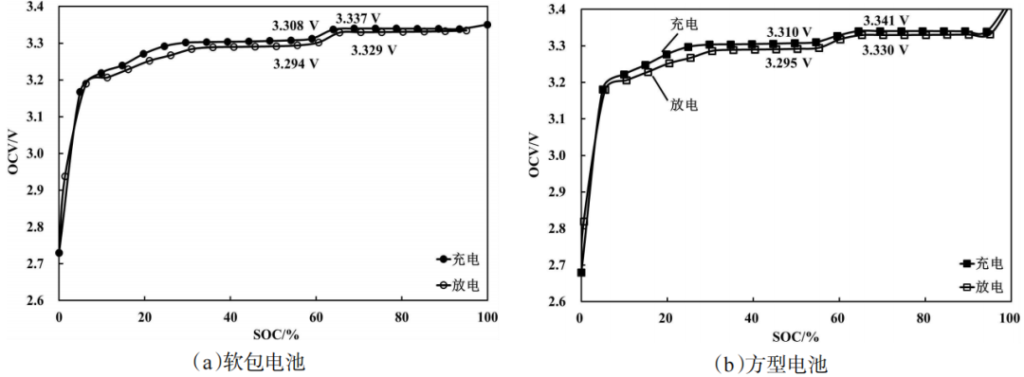
Figure 7 displays the charging and discharging SOC-OCV curves for both pouch cells and prismatic aluminum-shell LFP power batteries. It can be observed that the SOC-OCV curves for both types are nearly identical, indicating that the battery form factor has a minimal impact.
The charging SOC-OCV curve is slightly higher than the discharging SOC-OCV curve, which is related to the lithium-ion intercalation and de-intercalation kinetics during the charging and discharging processes. Due to the presence of the voltage hysteresis effect, the discharging OCV is lower than the true OCV value, while the charging OCV is higher. Furthermore, within the 50%–70% SOC range, the voltage step of the prismatic power battery is consistent with that of the pouch cell (both measuring between 30–40 mV) and shows little correlation with the direction of SOC adjustment.
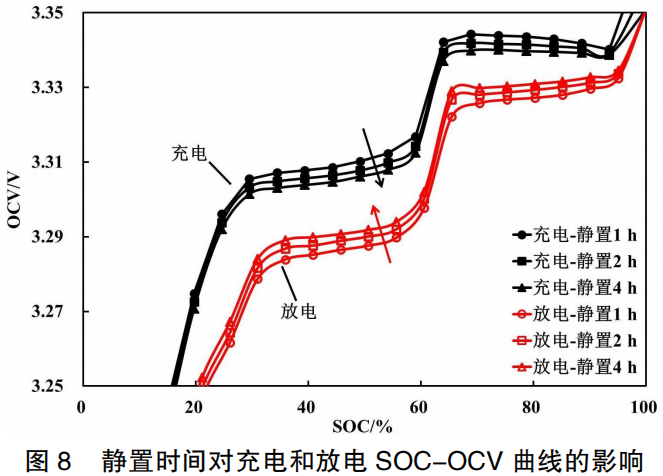
2.4 Rest Time
The existence of the voltage hysteresis effect is also reflected in the correlation between the charging/discharging SOC-OCV curves and the rest time following SOC adjustment. As shown in Figure 8, as the rest time increases from 1h to 2h, and further to 4h, the concentration polarization is gradually eliminated. With the extension of the rest time, the charging and discharging OCV curves gradually approach each other, and the hysteresis voltage progressively decreases, tending toward convergence.
2.5 Storage Fade
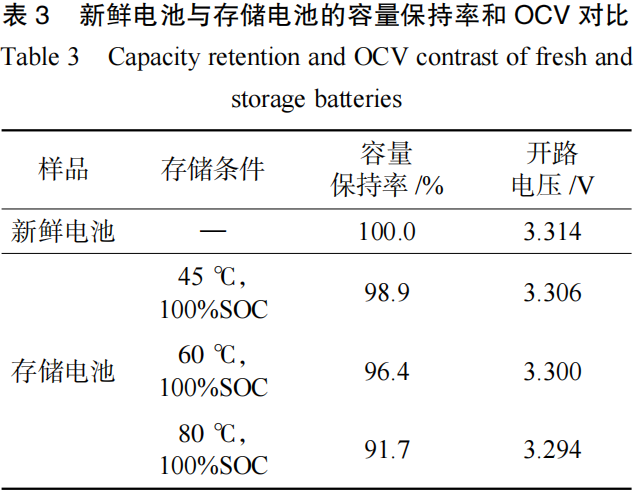
The amount of active lithium ions within a battery can influence the SOC-OCV curve. After storage, the battery capacity fades and the quantity of active lithium ions decreases, which consequently impacts the SOC-OCV curve. As shown in Table 3, the capacity retention rates of the batteries after storage at 45°C, 60°C, and 80°C were 98.9%, 96.4%, and 91.7%, respectively. These values correspond to the OCV at 60% SOC; specifically, a higher capacity retention rate correlates with a higher OCV at 60% SOC.
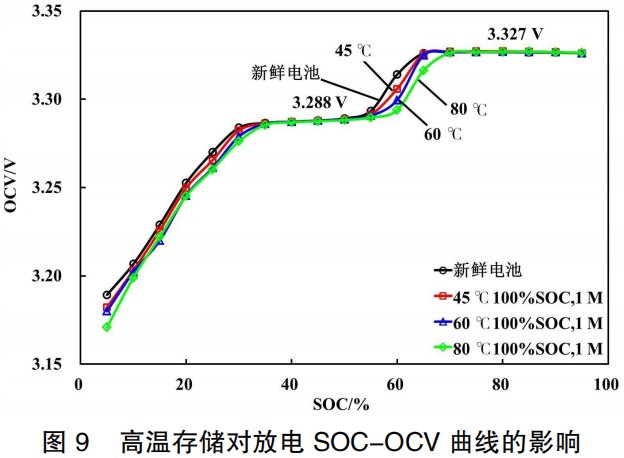
As shown in Figure 9, compared to the fresh battery, the SOC-OCV curves in the 50%–70% SOC range shift to the right after high-temperature storage. While the OCV at other SOC levels shows little change, an overall downward trend is observed. This is because high-temperature storage causes a reduction in the amount of active lithium ions within the battery. At the same SOC, the quantity of lithium ions intercalated into the anode decreases, which leads to an increase in anode potential. Consequently, the OCV at the same SOC decreases, resulting in a rightward shift of the curve.
2.6 Cycle Aging (or Cycling Degradation) Use Neware battery cyclers cycle your batteries
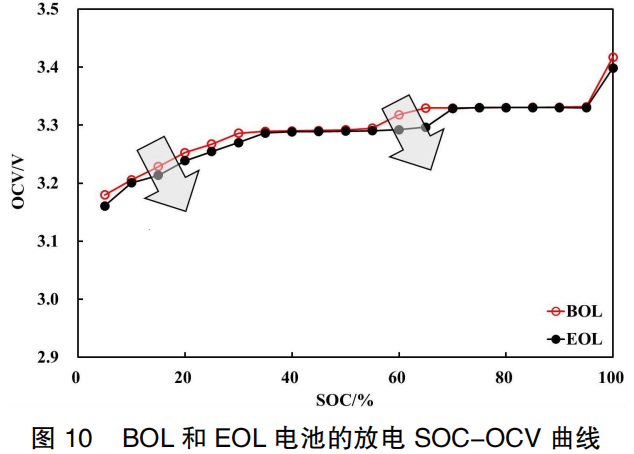
After charge-discharge cycling, the quantity of active lithium ions decreases, leading to capacity fade. The SOC-OCV curves of the battery at the Beginning of Life (BOL) and End of Life (EOL) are shown in Figure 10. Similar to storage aging, the capacity of the EOL battery fades, causing its SOC-OCV curve to shift to the right. When SOC ≤ 35%, the OCV shows a significant downward trend. In the 55%–70% SOC range, the OCV decreases substantially; for instance, at 60% and 65% SOC, the OCV difference between BOL and EOL batteries is 26 mV and 33 mV, respectively.
This is primarily because the capacity fade in EOL batteries reduces the amount of lithium ions intercalated into the graphite anode compared to BOL batteries at the same SOC. Consequently, the anode potential is higher, leading to a decrease in the overall OCV value. This results in the drop in the anode potential of the EOL battery lagging behind that of the BOL battery. When the BOL battery has almost completed its OCV voltage step, the EOL battery is only just beginning the step.
2.7 Anode Silicon Doping
Graphite is an intercalation-type layered anode material, whereas silicon anodes undergo alloying and de-alloying reactions during the lithiation and delithiation processes, classifying them as alloy-type anode materials. The theoretical specific capacity of silicon anode materials can reach as high as 3,580 mAh/g, and its lithiation/delithiation potential is approximately 0.4 V, which is slightly higher than that of graphite. Therefore, doping a portion of silicon material into a traditional graphite anode may impact the SOC-OCV curve of the battery.
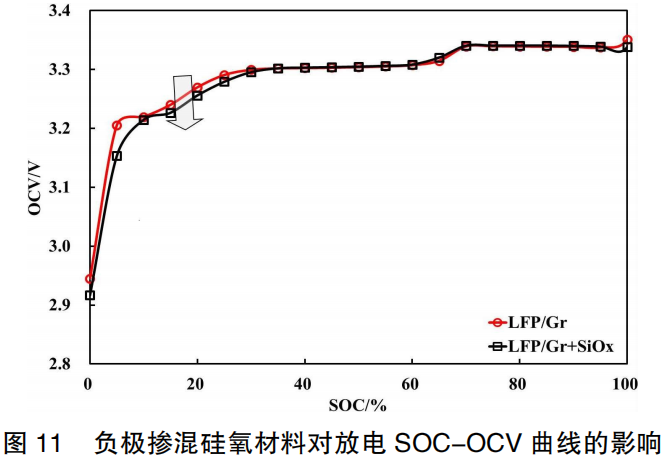
Figure 11 illustrates the discharge SOC-OCV curves for the two battery systems: LFP/Gr and LFP/Gr+SiO. As shown in the figure, the addition of 2.5 parts of silicon-oxygen (SiO) material to the anode has a significant impact on the OCV below 30% SOC, which exhibits a downward trend. This is primarily because the formation of $Li_2Si_2O_5$, $Li_2SiO_3$, and $Li_4SiO_4$ during lithium intercalation at low SOC levels leads to an increase in the anode potential.
2.8 Anode Pre-lithiation
As discussed above, factors such as low capacity utilization of active materials, storage fade, cycle aging, and the addition of silicon-oxygen materials to the anode lead to an increase in anode potential. This causes the SOC-OCV curve of the battery to shift to the right or results in a significant localized decrease in OCV. Conversely, if the anode undergoes pre-lithiation to decrease the anode potential, the SOC-OCV curve of the battery should theoretically shift to the left.
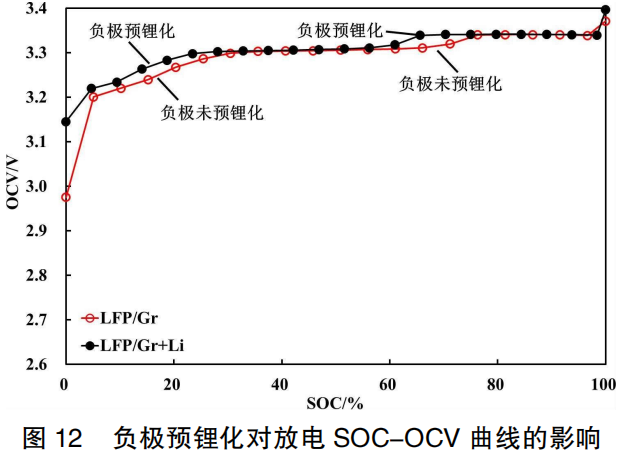
Figure 12 presents the discharge SOC-OCV curves for the two battery systems: LFP/Gr and LFP/Gr+Li. It can be observed that when SOC ≤ 30%, the battery OCV is significantly improved, especially at 0% SOC. This is because after lithium replenishment (pre-lithiation) of the anode, a portion of active lithium ions remains stored within the negative electrode even when discharged to 0% SOC; consequently, the anode potential remains relatively low, resulting in a higher full-cell OCV. Furthermore, after anode lithium replenishment, the phase transition in the 60%–75% SOC range occurs earlier, causing the OCV voltage step to appear prematurely and the curve to shift to the left.
2.9 Coin Cell Analysis
In order to distinguish the correlation between the full-cell SOC-OCV curve and the individual contributions of the positive and negative electrodes, LFP/Li and Gr/Li coin cells were prepared. Their measured SOC-OCV curves are shown in Figure 13. Following the de-intercalation of lithium ions from the positive electrode, lithium iron phosphate (LiFePO4) transforms into iron phosphate (FePO4). As seen in Figure 13(a), when SOC ≥ 10%, the positive electrode potential exhibits minimal variation, with the OCV fluctuating within a range of less than 10 mV.
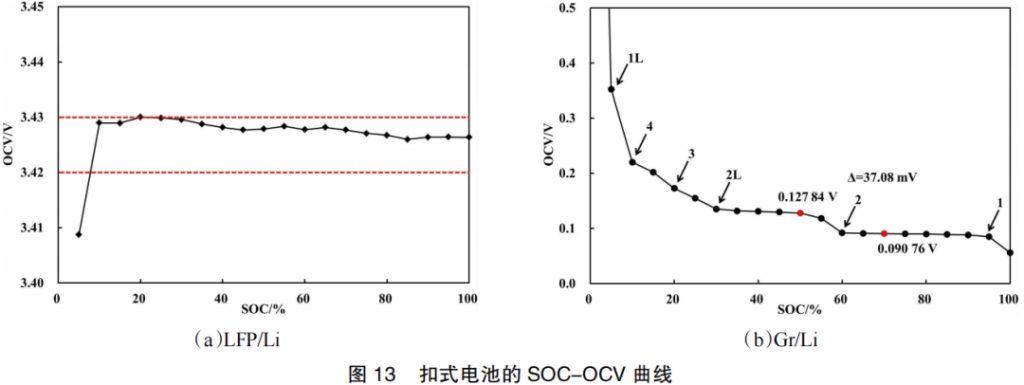
As lithium ions are intercalated into the negative electrode, graphite transforms into graphite intercalation compounds (GICs), such as LiC24, LiC12, and LiC6. As shown in Figure 13(b), several stages are formed: Stage 1L near 5% SOC, Stage 4 near 10% SOC, Stage 3 near 20% SOC, Stage 2L near 30% SOC, Stage 2 near 60% SOC, and Stage 1 near 95% SOC.
When SOC ≤ 30%, lithium intercalation causes significant fluctuations in the anode potential. There is also a fluctuation of 37.08 mV between 50% and 70% SOC, which is consistent with the OCV voltage step observed in the full cell at this range. Therefore, the SOC-OCV curve of the LFP/Gr full cell is primarily influenced by the potential changes of the negative electrode, while the potential variation of the LFP positive electrode has a negligible effect. This is because the (de)intercalation reaction of LiFePO4 is a multi-phase reaction; according to Gibbs’ Phase Rule, its half-cell degree of freedom is zero, which means its OCV does not vary with the state of charge.
2.10 Battery Post-Mortem Analysis
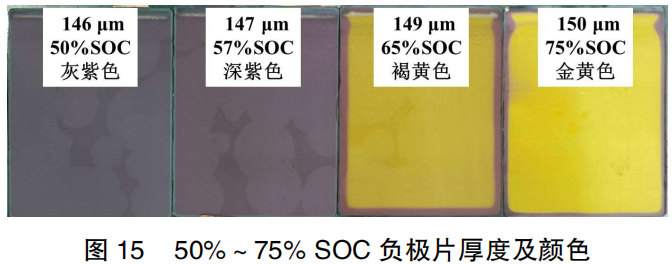
The battery undergoes an OCV voltage step within the 50%–75% SOC range. To investigate this, four batteries were adjusted to 50% SOC, 57% SOC, 65% SOC, and 75% SOC, respectively, to observe the changes in the potential, color, and thickness of the negative electrode plates during the OCV step. As shown in Table 4, the OCV of the LFP/Gr full cell exhibited a step of 30 mV between 57% SOC and 65% SOC.
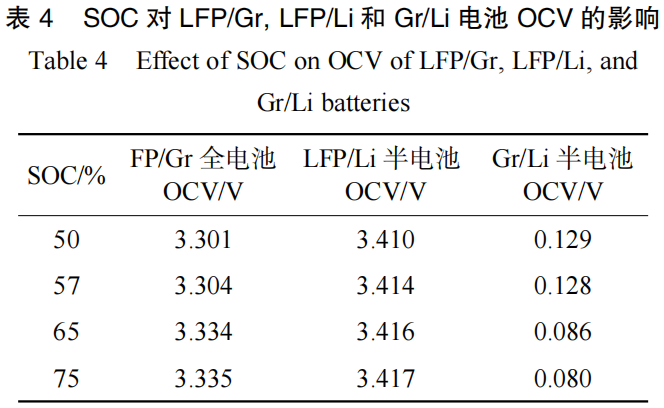
The full cells were disassembled, and the OCV values of the LFP/Li half-cells and Gr/Li half-cells were measured in real-time, as shown in Figure 14. As indicated in Table 4, the OCV of the Gr/Li half-cell decreased significantly by approximately 42 mV, whereas the OCV of the LFP/Li half-cell changed by only 2 mV. This demonstrates that the changes in the negative electrode induced by the SOC are the primary cause of the OCV voltage step at this stage.
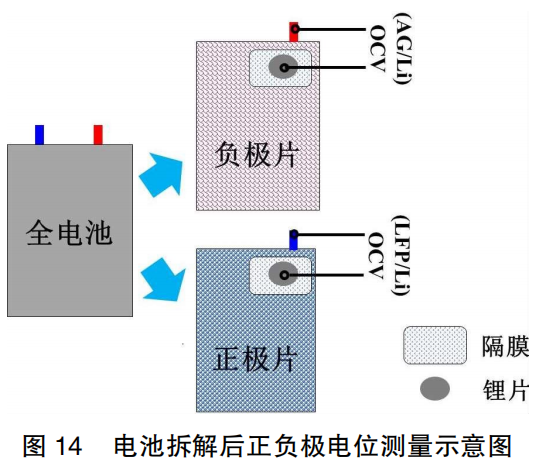
Figure 15 shows the changes in the thickness and color of the negative electrode plates within the 50%–75% SOC range. As observed in Figure 15, with the increase of SOC, the color of the electrode plates transforms from blackish-purple → deep purple → deep yellow → golden yellow, accompanied by a slight increase in electrode thickness. Following the OCV voltage step in the full cell from 57% SOC to 65% SOC, the majority of the electrode plate—excluding the edges—changes from deep purple to deep yellow. The thickness increases by only 2 μm, indicating that the transformation of graphite intercalation compounds (GICs) at this stage has a minimal impact on the graphite interlayer spacing.
3 Conclusion
The magnitude of a full-cell OCV is determined by material properties and is independent of the battery form factor (e.g., prismatic cells or pouch cells). Differences in the actual capacity utilization of various types of lithium iron phosphate (LFP) and graphite active materials can lead to variations in the initial capacity of the full cell, thereby influencing the SOC-OCV curve. The OCV curve is also affected by the current direction used for SOC adjustment (charging vs. discharging). Due to the voltage hysteresis effect, the discharge SOC-OCV curve is lower than the charging curve; however, as the rest time increases following SOC adjustment, polarization is eliminated, and the two curves tend to converge.
Storage and charge-discharge cycling can cause capacity fade, leading to a rightward shift in the SOC-OCV curve. Similarly, doping the negative electrode with silicon-oxygen (SiO) materials increases the anode potential, causing a rightward shift. Conversely, using lithium strips for pre-lithiation decreases the anode potential, causing the SOC-OCV curve to shift to the left. The SOC-OCV curve of the full cell is primarily determined by the negative electrode. The OCV voltage step of approximately 35 mV observed near 60% SOC originates mainly from the phase transition of the lithiated graphite anode and has little correlation with the LFP cathode.
Reference:
LIU Bozheng, SUN Xinyi, DONG Shijia, et al. Analysis of Open Circuit Voltage Curve Characteristics of Lithium Iron Phosphate Batteries [J]. Energy Research and Management, 2023, 15(1): 7.
刘伯峥,孙馨怡,董世佳,等.磷酸铁锂电池开路电压曲线特性分析[J].能源研究与管理, 2023, 15(1):7.
Due to the limited knowledge and English level is inevitable errors and omissions, if there are errors or infringement of the text, please contact me as soon as possible by private letter, I will immediately be corrected or deleted.