
How to determine electrochemical reversibility from cyclic voltammetry?
Description: This article delineates the methodology for evaluating the reversibility of electrochemical reactions using Cyclic Voltammetry (CV). The core criteria for assessment are the peak potential separation (ΔEp) between the anodic and cathodic peaks, and the peak current ratio (ipa/ipc). By incorporating the effects of scan rates, a comprehensive evaluation is conducted to distinguish between reversible, quasi-reversible, and irreversible redox processes.
I. Definition of electrochemical reversibility?
Electrochemical reversibility specifically refers to the ability of an electrode reaction to rapidly achieve thermodynamic equilibrium during the transition between oxidized and reduced states, characterized by the absence of significant kinetic barriers. Its core feature is the seamless interconversion between oxidation and reduction processes under infinitesimal potential fluctuations. The change in Gibbs free energy (Δ G) strictly adheres to thermodynamic equilibrium conditions, and the reaction proceeds without any irreversible side reactions.
Conversely, a reaction that fails to reach equilibrium rapidly due to substantial kinetic resistance or the occurrence of side reactions is classified as an irreversible reaction. Processes situated between these two extremes, which exhibit moderate kinetic resistance but can partially achieve equilibrium, are defined as quasi-reversible reactions.
Source: DOI: 10.1021/acs.jpclett.5c00849
II. Principles of Cyclic Voltammetry (CV)
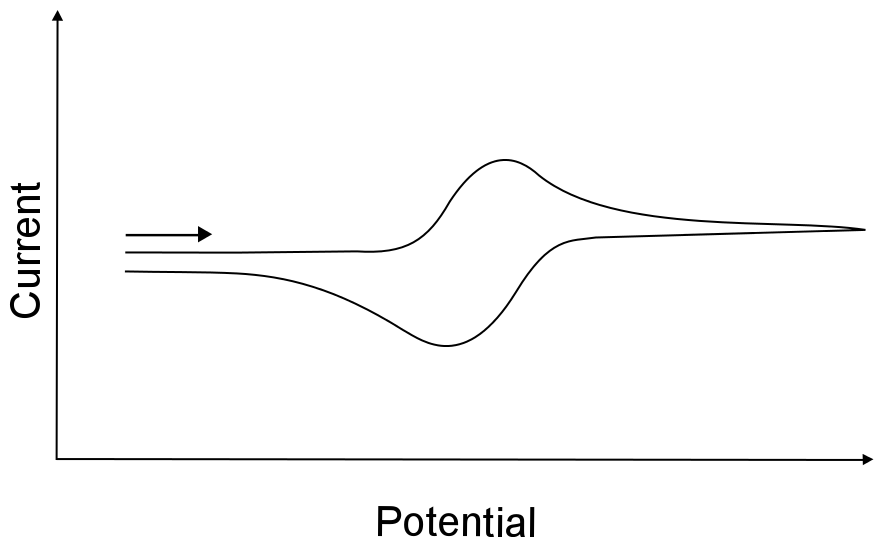
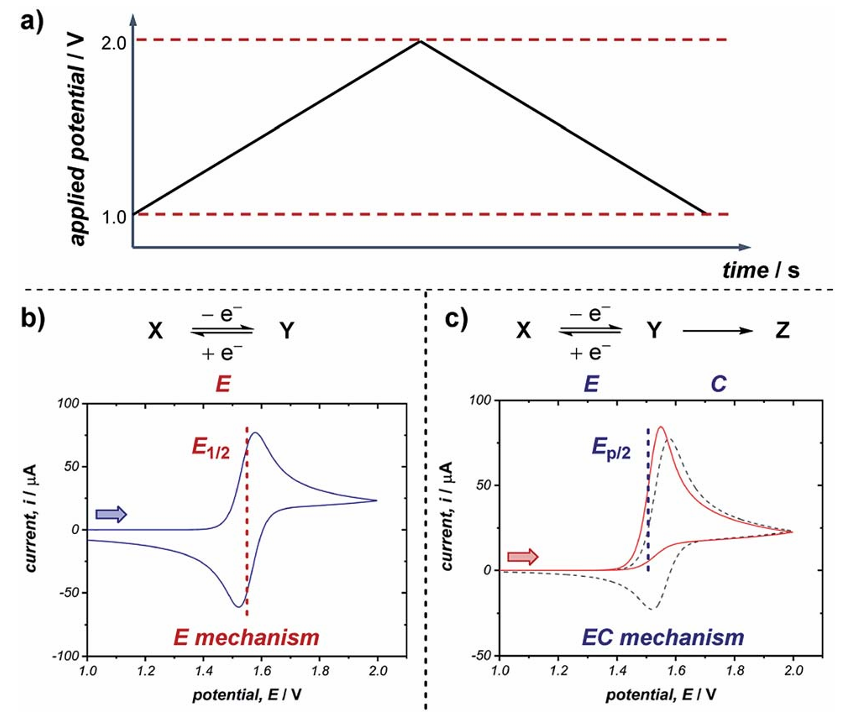
CV characterizes electrochemical systems by linearly scanning the electrode potential. Within a predefined potential window, the instrument executes both forward and reverse sweeps, recording the resulting faradaic current as a function of the applied potential.
During the forward sweep, an oxidation reaction (anodic process) occurs at the electrode surface, yielding an anodic peak. Conversely, during the reverse sweep, the oxidation products generated in the prior step undergo a reduction reaction (cathodic process), producing a cathodic peak. For a reversible reaction, the redox processes are kinetically rapid and internally consistent, resulting in a CV profile with well-defined diagnostic features. In contrast, irreversible reactions exhibit significant kinetic resistance, leading to deviations or distortions in the voltammogram characteristics. This fundamental difference in electrochemical response serves as the core mechanistic basis for evaluating reversibility via CV.
Source: DOI: 10.1039/d2cs00706a
III. How to Evaluate Reaction Reversibility or electrochemical reversibility via CV Curves?
1. Peak Potential Separation Criteria
The separation between the anodic peak potential (Epa) and the cathodic peak potential (Epc), denoted as delta Ep (calculated as Epa – Epc), serves as the most direct and core diagnostic criterion for assessing reaction reversibility. Its magnitude directly reflects the facility with which the reaction achieves thermodynamic equilibrium, with the evaluation standards derived from the Nernst equation.
For a reversible electrode reaction involving a single-electron transfer at standard state (25 degrees Celsius), the theoretical value of delta Ep derived from the Nernst equation is 59 mV (0.059 V). This value is a fundamental hallmark of a reversible reaction. Mechanistically, it signifies that when the reaction reaches thermodynamic equilibrium, the activity ratio of the oxidized to reduced states strictly satisfies the Nernst equation. Under these conditions, the charge transfer rate is significantly faster than the mass diffusion rate, resulting in negligible kinetic resistance.
(Source: DOI: 10.1021/acs.jpclett.2c02464)
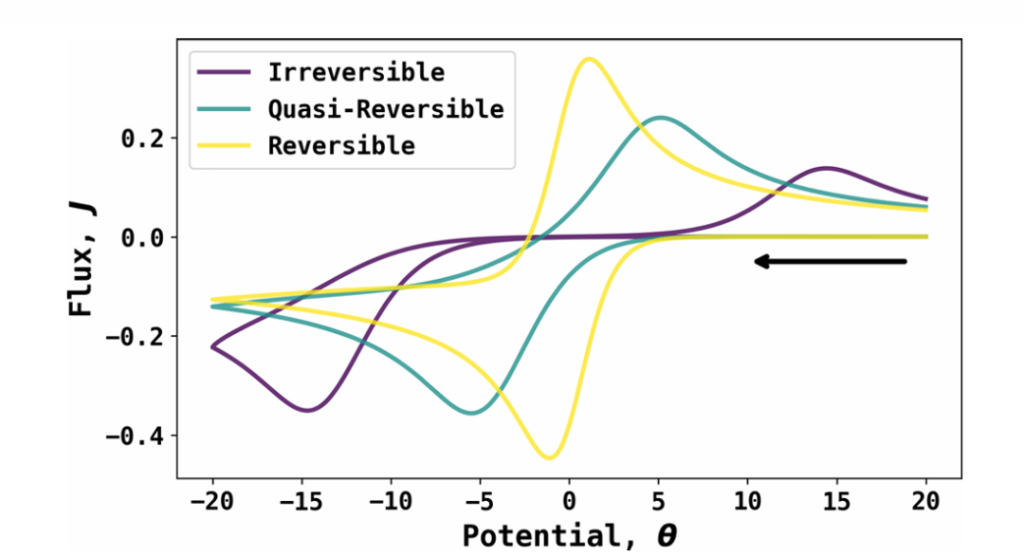
Irreversible Reactions
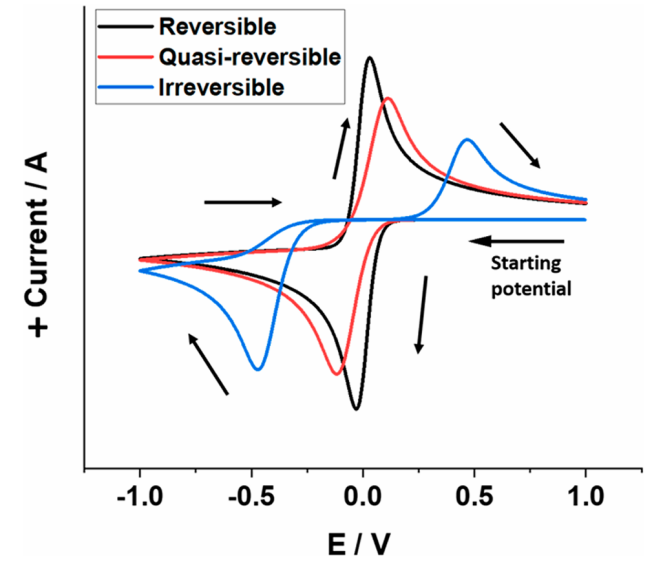
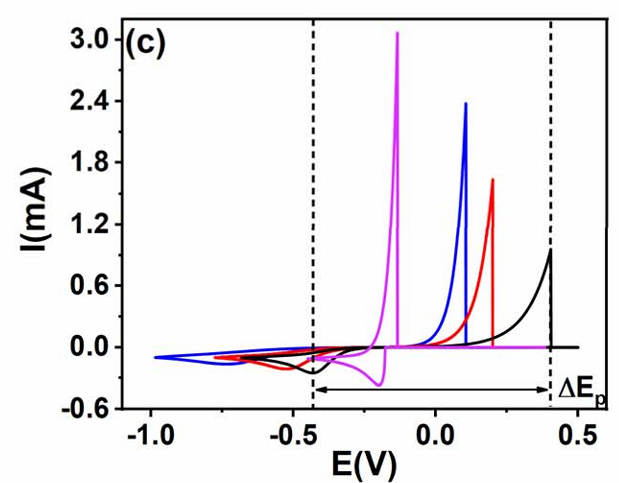
Irreversible electrode reactions exhibit significant kinetic resistance, causing the anodic peak potential to shift in the positive direction and the cathodic peak potential to shift in the negative direction. This results in a substantial increase in delta Ep, which no longer follows the theoretical Nernstian behavior. In a single-electron transfer process, a reaction is classified as irreversible when delta Ep exceeds 100 mV. Furthermore, a larger delta Ep indicates a higher degree of irreversibility and stronger kinetic resistance.
Quasi-reversible Reactions
For quasi-reversible reactions, delta Ep falls between the reversible and irreversible thresholds—specifically, between 59 mV and 100 mV for single-electron transfer processes. These reactions exhibit moderate kinetic resistance but can partially achieve equilibrium. While the CV peak profiles appear similar to those of reversible reactions, they show more pronounced peak potential shifts. Crucially, delta Ep fluctuates slightly with changes in scan rate, which serves as a key diagnostic criterion to distinguish them from fully reversible systems.
(Source: DOI: 10.1039/d5sc05636e)
2. Peak Current Criteria
The ratio of the anodic peak current (ipa) to the cathodic peak current (ipc), denoted as ipa/ipc, serves as a crucial auxiliary criterion for evaluating reaction reversibility. It reflects the degree of reduction of the oxidation products—essentially the efficiency of the reversible conversion—and its diagnostic logic is based on the kinetic characteristics of reversible reactions under diffusion control.
Reversible Reactions
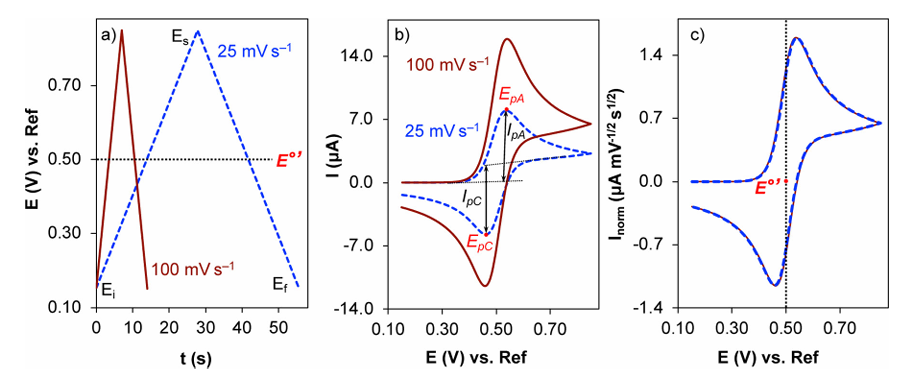
In a reversible electrode reaction, the oxidation products generated during the forward sweep can be fully reduced during the reverse sweep; therefore, the theoretical value of ipa/ipc is 1 (where ipa = ipc). This ratio assumes a moderate scan rate where the reaction is situated within the diffusion-controlled region. Under these conditions, the peak current magnitude follows the Randles-Sevcik equation, where the peak current is directly proportional to the square root of the scan rate (v^1/2). Furthermore, the growth rates of the anodic and cathodic peak currents remain synchronized, keeping the ratio stable.
In practical testing, the ipa/ipc ratio of a reversible reaction may fluctuate slightly around 1.0 (typically within the range of 0.9 to 1.1) due to factors such as electrode surface conditions, diffusion layer thickness, and system impurities. In the absence of significant external interference, the reaction can still be classified as reversible; however, if the ratio deviates substantially from this range, further verification using peak potential separation is required.
(Source: DOI: 10.1039/C7SC03498A)
Irreversible Reactions
In irreversible electrode reactions, the oxidation products generated during the forward sweep cannot be fully reduced. A portion of these products may undergo decomposition, agglomeration, or side reactions, leading to a significant decrease in the cathodic peak current and an ipa/ipc ratio much greater than 1. As the degree of irreversibility increases, this ratio grows larger; in highly irreversible reactions, the reduction peak may become extremely weak or even disappear entirely, leaving only the oxidation peak observable.
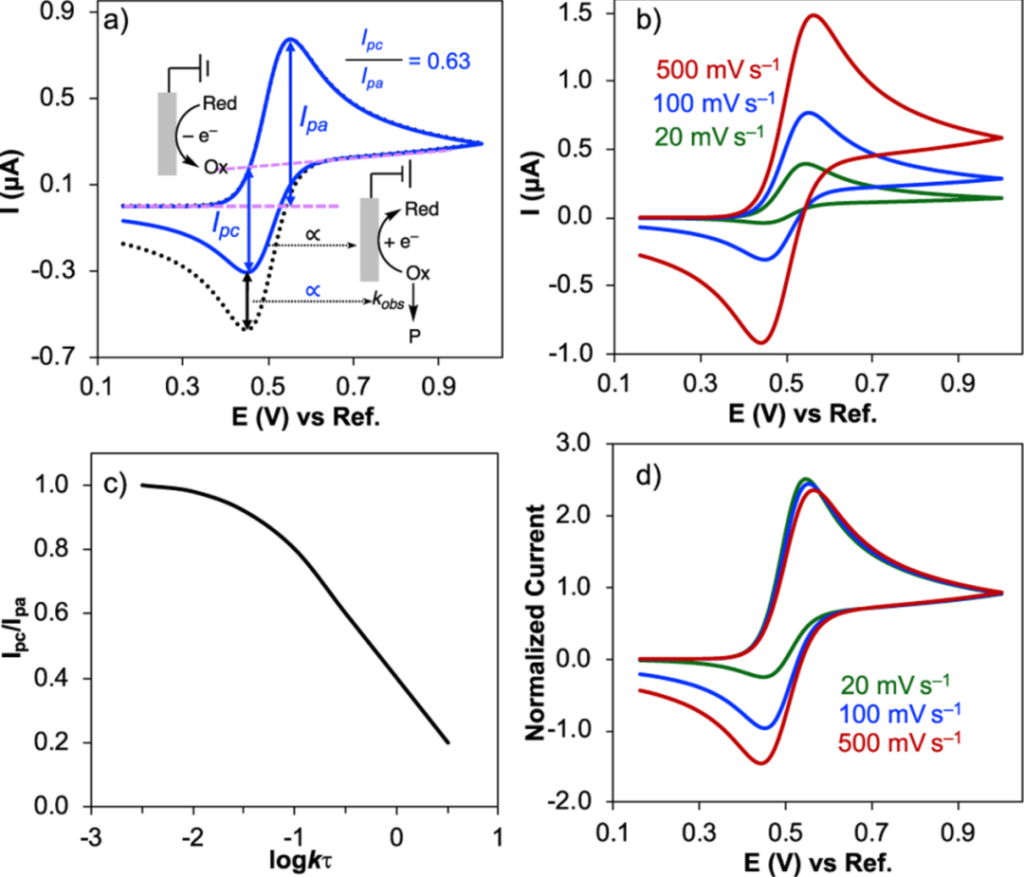
Quasi-reversible Reactions
For quasi-reversible reactions, the ipa/ipc ratio typically falls between 0.5 and 0.9 (for single-electron transfer processes). While the oxidation products can be partially reduced, the extent to which the ratio deviates from 1.0 is positively correlated with kinetic resistance—the higher the resistance, the more pronounced the deviation. Although the peak current still maintains a linear relationship with the square root of the scan rate (v^1/2), the linear correlation coefficient is lower than that of reversible reactions, serving as an additional diagnostic feature for differentiation.
(Source: DOI: 10.1039/d2cs00706a)
3. Influence of Scan Rate
Reversible Reactions
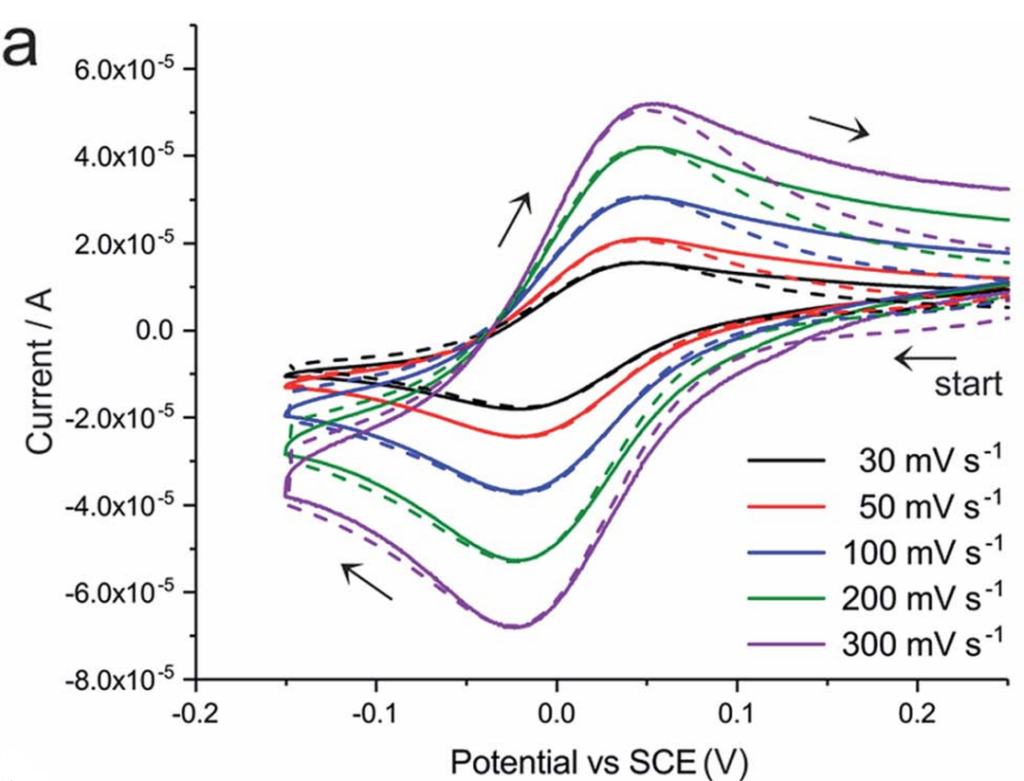
In a reversible electrode reaction, the charge transfer rate is significantly higher than the mass diffusion rate, maintaining the reaction in a diffusion-controlled state. Consequently, the cyclic voltammetry (CV) characteristics exhibit well-defined patterns in response to changes in scan rate. As the scan rate increases, both the anodic and cathodic peak currents grow in direct proportion to the square root of the scan rate (v^1/2), strictly adhering to the Randles-Sevcik equation. The peak profiles remain symmetrical, sharp, and show no significant broadening.
Furthermore, the peak potential separation (delta Ep) of a reversible reaction remains nearly independent of the scan rate. Regardless of whether the scan rate is increased or decreased, delta Ep consistently stays near the theoretical value (approximately 59 mV for a single-electron transfer). This independence from scan rate is the core distinction between reversible and non-reversible reactions and serves as a critical diagnostic criterion for verifying electrochemical reversibility.
Irreversible Reactions
In irreversible reactions, the impact of kinetic resistance intensifies as the scan rate increases. This causes the anodic peak potential to shift further in the positive direction and the cathodic peak potential to shift further in the negative direction, leading to a significant expansion of delta Ep with increasing scan rates. The peak profiles gradually broaden and become blunt (passivated). Furthermore, the peak current no longer maintains a strict linear relationship with the square root of the scan rate (v^1/2), resulting in a marked decrease in the linear correlation coefficient. At high scan rates, the cathodic peak may disappear entirely.
Quasi-reversible Reactions
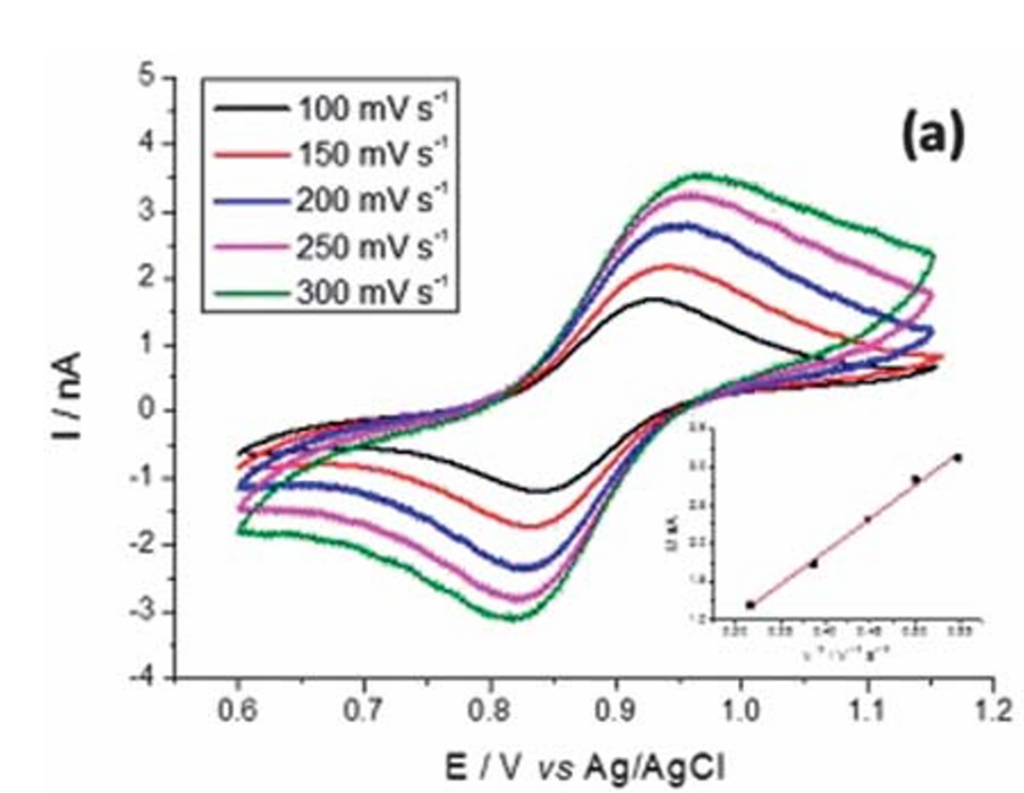
For quasi-reversible reactions, delta Ep increases slightly as the scan rate rises, though the magnitude of this increase is smaller than that observed in irreversible reactions. The peak profiles exhibit minor broadening with increasing scan rates, yet distinct anodic and cathodic peaks remain observable. The peak current maintains a linear relationship with the square root of the scan rate (v^1/2), with a linear correlation coefficient falling between those of reversible and irreversible reactions. Additionally, the ipa/ipc ratio deviates slightly further from 1.0 as the scan rate increases.
(Source: DOI: 10.1039/C9SC01545K)
Summary
Evaluating reaction reversibility via Cyclic Voltammetry (CV) centers on two primary criteria: peak potential separation and peak current ratio, synthesized with the influence of scan rate. This multi-faceted approach ensures cross-verification and effectively prevents misjudgments caused by relying on a single parameter.
The overall diagnostic logic can be simplified as follows: First, observe whether the CV curve exhibits paired redox peaks; a single peak indicates an irreversible reaction. If paired peaks are present, calculate the delta Ep and ipa/ipc ratio. By comparing these against theoretical delta Ep values (based on the number of electrons transferred) and analyzing the effects of scan rate, the reaction can be definitively classified as reversible, quasi-reversible, or irreversible.
It is important to note that in practical testing, CV characteristics are influenced by factors such as scan rate, temperature, electrolyte concentration, electrode surface conditions, and pH levels. Therefore, testing conditions must be strictly controlled to ensure consistency and eliminate external interference before making an assessment.
For multi-electron transfer processes or complex systems, quantitative calculations using the Nernst equation and Randles-Sevcik equation are required. When necessary, other electrochemical characterization methods—such as Electrochemical Impedance Spectroscopy (EIS) and Chronoamperometry (CA)—should be employed to further validate the results and ensure accuracy.
(Source: DOI: 10.1021/acs.jpclett.2c02464)
Due to my limited expertise and language proficiency, errors and omissions may occur. Should you identify any inaccuracies or potential copyright issues, please contact me via private message. I will rectify or remove the content immediately.