
How to overcharge a lithium iron phosphate EV prismatic battery cell?
Abstract: Overcharge-induced thermal runaway (TR) tests were conducted on prismatic lithium iron phosphate (LiFePO4) power batteries. Four distinct stages of thermal runaway during overcharging were summarized, providing a technical reference for the prediction, prevention, and control of overcharge-induced thermal runaway in battery systems.
Keywords: Power battery; Lithium iron phosphate (LiFePO4); Overcharge thermal runaway; Prediction and prevention
Incidents of spontaneous combustion, fires, and explosions in electric vehicles (EVs) occur occasionally, the vast majority of which are caused by battery failures. The primary factors triggering battery safety accidents include overcharge, over-discharge, mechanical damage, battery aging, and overheating. Among these, battery overcharging is a high-risk factor for thermal runaway. This paper investigates the relationship between the external characteristics and internal reaction mechanisms of thermal runaway induced by overcharging in LiFePO4 batteries, which are widely utilized in new energy vehicles.
1 EV prismatic battery cell Overcharge Test
1.1 Test Preparation
The test samples are new prismatic aluminum-case lithium iron phosphate (LiFePO4) cells, with LiFePO4 as the cathode material and graphite as the anode material. The energy density of the battery is 164.8 Wh/kg, and the rated capacity is 206 Ah. The normal operating voltage range is 2.5–3.65 V. The operating temperature ranges for charging and discharging are 0–55 °C and -20–55 °C, respectively.
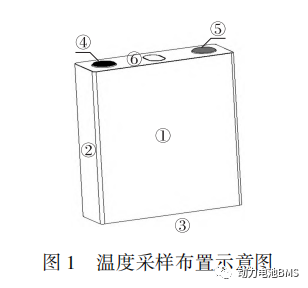
As shown in Figure 1, temperature sensors are placed at the center of the front surface ①, the center of the side ②, the center of the bottom ③, the negative terminal ④, the positive terminal ⑤, and the safety vent ⑥ of the single cell to record the temperature during the test. The battery voltage is also collected throughout the experimental process.
Neware battery charging and discharging equipment
Neware aux channels ( temperature sensors )
To ensure that the overcharge test data closely aligns with real-world conditions, the front and back surfaces of the single cell are secured with fixtures to prevent structural deformation caused by internal gas generation during overcharging. The surfaces of the fixtures are wrapped with thermal insulation cotton to minimize heat loss, thereby simulating the actual environment within a battery pack.
1.2 Test Methods and Results
To investigate the variations in voltage, temperature, and Direct Current Resistance (DCR) during the battery overcharge process, the following tests were conducted. The methods and results are as follows:
1) Single Cell Capacity Retention Test At room temperature, the cell was discharged at a constant current (CC) of 206 A until the voltage reached 2.5 V. Subsequently, it was charged at 206 A to 3.65 V, followed by a constant voltage (CV) charge at 3.65 V until the current dropped below 10.3 A, after which it was left to rest for 1 h. Finally, the cell was discharged at 206 A to 2.5 V, and the discharge capacity was recorded. This procedure was repeated three times.
Test Results: The recorded capacities of the single cell were 206.5 Ah, 206.7 Ah, and 207.1 Ah, respectively, meeting the nominal capacity requirements.
2) Overcharge Thermal Runaway Test At room temperature, starting from an initial State of Charge (SOC) of 0, the single cell was subjected to constant current overcharging at a 1 C rate. The test utilized an alternating cycle of 6 minutes of charging followed by 10 seconds of rest. After 12 cycles, at 4,564 s, both the temperature and voltage of the battery rose sharply, signaling the onset of internal thermal runaway. The charging process concluded at 4,680 s.
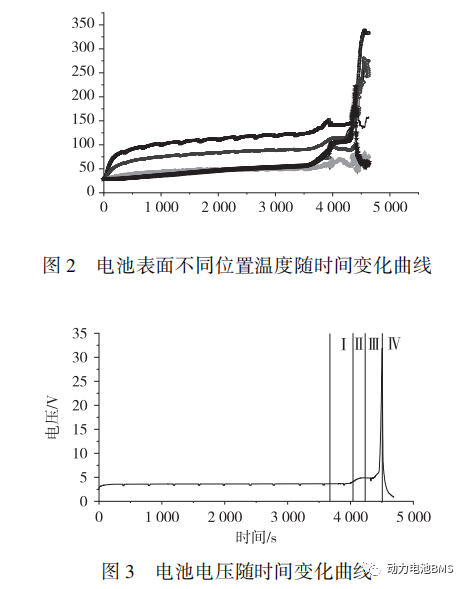
The battery surface temperatures recorded throughout the test are shown in Figure 2. Post-thermal runaway, the peak temperatures were as follows:
Negative Terminal: 340 °C
Positive Terminal: 272.6 °C
Safety Vent: 84.4 °C
Front Surface: 278.6 °C
Side Surface: 222.6 °C
Bottom Surface: 188.5 °C
The variation of voltage over time is illustrated in Figure 3, with the peak overcharge voltage reaching 32 V.
3) Direct Current Resistance (DCR) Characterization To further understand the internal changes within the single cell during the overcharge test, Direct Current Resistance (DCR) was employed as a characterizing parameter. The DCR test method refers to Section 7.2 of the standard GB/T 31467.2—2015 [8].
As shown in Figure 4, the variations in DCR exhibit a clear regularity:
When the State of Charge (SOC) is below 100%, the DCR shows no significant changes.
When the SOC exceeds 100%, the DCR increases linearly, reaching a peak value of 1.3 mΩ at 117% SOC, after which it decreases sharply.
Since the entire test was conducted under constant current (CC) conditions, the SOC increased linearly over time, rising from 0% to 126%.
2 Analysis of Test Results
The capacity retention test results indicate that the tested cells meet the nominal capacity requirements and are suitable for subsequent experiments.
2.1 Temperature Analysis at Different Locations on the Battery Surface
As observed in Figure 2, the battery surface temperature exhibits an overall upward trend as charging time increases. Prior to the onset of thermal runaway, the surface temperatures can be categorized into three thermal layers:
Low-temperature layer: Front surface, side surface, bottom surface, and safety vent surface.
Medium-temperature layer: Positive terminal surface.
High-temperature layer: Negative terminal surface.
This temperature distribution is determined by the respective thermal conduction paths:
Negative terminal path: Anode material (graphite) → Current collector (copper foil) → Tab (copper) → Negative post.
Positive terminal path: Cathode material (LiFePO4) → Current collector (aluminum foil) → Tab (aluminum) → Positive post.
Surface/Bottom/Vent path: Electrode materials (LiFePO4/graphite) → Separator (polypropylene film) → Cell casing (aluminum).
Since the thermal conductivity of copper > aluminum > separator, the temperature relationship follows: Negative terminal > Positive terminal > Cell surface. This demonstrates that the negative terminal temperature reflects internal battery temperature changes more timely and accurately. Therefore, in battery PACK integration design, temperature sampling points should be positioned near the negative terminal.
2.2 Battery Voltage Analysis
As illustrated in Figure 3, the battery voltage increases with charging time prior to thermal runaway. During the normal charging interval (within approximately 4,000 s), the battery is in the plateau phase, where the voltage remains relatively stable with only a marginal increase. From 4,000 to 4,220 s, the battery voltage undergoes its first rapid growth, reaching 4.9 V. Between 4,450 and 4,500 s, the voltage surges to 32 V at an extreme rate, followed by a swift drop to approximately 0.1 V.
2.3 SOC and DCR Analysis
According to Figure 4, the Direct Current Resistance (DCR) of the battery initially decreases and then increases. Within the first 2,660 s, the DCR remains below 1 mΩ. Upon overcharging to approximately 3,900 s, the DCR reaches its peak value of 1.3 mΩ.
The variation in DCR during the experimental process is closely related to the internal chemical reactions of the battery. Based on these resistance variation characteristics, the entire process is divided into five intervals, as shown in Figure 4:
1) Intervals ① and ② represent the normal charging reactions of the battery. As the battery temperature rises during the charging process, the DCR (Direct Current Resistance) initially decreases before subsequently increasing.
2) In Interval ③, electrolyte decomposition occurs, generating a substantial volume of gas, which leads to a sharp increase in DCR.
3) In Interval ④, the rising internal temperature causes large-scale shrinkage of the separator, resulting in multiple internal short circuits within the battery. Consequently, the DCR drops precipitously.
4) In Interval ⑤, a significant amount of electrolyte is ejected through the safety vent, leading to a drastic reduction of internal electrolyte and a sharp decline in ionic concentration. Simultaneously, a large volume of gas is generated between the jelly rolls, causing the DCR to surge again.
In conclusion, the DCR exhibits violent fluctuations during the overcharge-induced thermal runaway process. This variation pattern can serve as a critical reference for battery safety early-warning systems.
2.4 Analysis of Battery Thermal Runaway
Based on Figure 3, the entire overcharge process can be divided into four stages. To clarify the characteristics of thermal runaway, the following analysis integrates internal reaction mechanisms with the data from Figure 2:
1) Stage I (3,678–4,046 s): At approximately 3,856 s, the electrolyte begins to decompose while the voltage remains below 4.5 V. Lithium plating starts to occur on the surface of the graphite anode and reacts with the electrolyte. This leads to an increase in SEI (Solid Electrolyte Interphase) film thickness and a significant rise in internal resistance. Consequently, the temperature rise rate exceeds that of the normal charging phase.
2) Stage II (4,046–4,232 s): At 4,210 s, the battery voltage reaches 4.90 V, followed by a slight decrease, indicating the onset of SEI film decomposition. The decomposition of the electrolyte intensifies, generating a large volume of gas. By 4,232 s, the battery exhibits obvious swelling (bulging).
3) Stage III (4,232–4,504 s): At approximately 4,325 s, the safety vent opens, signaling the occurrence of thermal runaway. At this point, the voltage is 4.77 V, and the negative terminal temperature reaches 150.3 °C. The ejection of electrolyte and decomposition products carries away some heat, causing the negative terminal temperature to dip slightly to 141 °C. Around 4,504 s, the internal resistance surges, the voltage rises rapidly to approximately 32 V, and the battery emits a large volume of white smoke due to the violent decomposition of internal components.
4) Stage IV (4,504–4,688 s): Large-scale separator shrinkage occurs, leading to massive internal short circuits. The voltage drops rapidly to about 0.3 V, while the temperature rises sharply. As the thermal barrier provided by the separator is significantly diminished, heat reaches the battery casing surface more quickly, narrowing the temperature gradient between different locations. The peak temperature reaches 340 °C at 4,635 s.
Summary of Overcharge Stages:
Stages I & II (Early Stage): The voltage exceeds normal limits and the surface temperature rise accelerates. Although the electrochemical and thermal features are not yet dramatic, they are identifiable. If charging is terminated during this stage, the LFP battery remains in a safe state and thermal runaway can be avoided.
Stage III (Middle Stage): This stage involves destructive damage. Thermal characteristics become prominent. Stopping the charge immediately might still prevent thermal runaway, but the battery will be permanently disabled (incapable of further charging or discharging).
Stage IV (Final Stage): Characterized by massive separator shrinkage and internal short circuits. Internal pressure surges until the safety vent opens and thermal runaway becomes inevitable. At this point, terminating the charge can no longer prevent the catastrophic failure.
3 Conclusion
In this study, 1 C overcharge tests were conducted on a specific lithium iron phosphate (LiFePO4) battery. By analyzing three key test variables—temperature mechanism, voltage, and internal resistance—in conjunction with internal reaction processes, the entire overcharge-induced thermal runaway process of prismatic LiFePO4 power batteries was investigated [9–10].
By extracting data variation characteristics from the experiments, it was found that the voltage and temperature features of each stage are distinct. These findings can be utilized to formulate safety protection strategies for Battery Management Systems (BMS). Furthermore, they provide a valuable reference for early-stage safety risk identification and the prevention of safety accidents, while offering technical guidance for the integrated design of battery systems.
Due to the limited knowledge and English level is inevitable errors and omissions, if there are errors or infringement of the text, please contact me as soon as possible by private letter, I will immediately be corrected or deleted.