
Hybrid Pulse Power Characterization (HPPC) is a test designed to characterize the pulse charging and discharging performance of EV batteries. It serves as a critical methodology in battery performance assessment, primarily targeting the performance evaluation and power management of battery systems, modules, and battery cells for hybrid electric vehicles (HEVs). This article focuses on the test principles, methodologies, and practical application cases of HPPC.

1. Definition and Scope of HPPC Test for EV batteries
HPPC (Hybrid Pulse Power Characterization) is a characterization test used to demonstrate the pulse charging and discharging performance of traction batteries. The characteristic curve of the HPPC test is shown in Figure 1 (a). Its objective is to demonstrate the discharge and regenerative charging pulse power capabilities for power-assist targets at various Depths of Discharge (DOD).
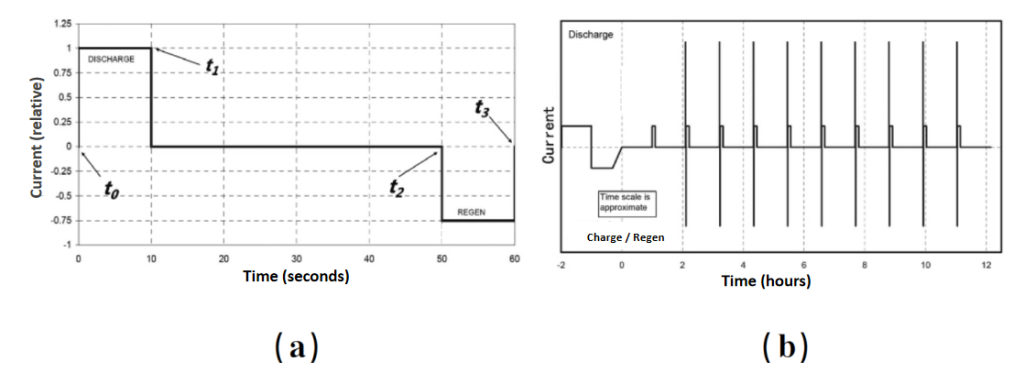
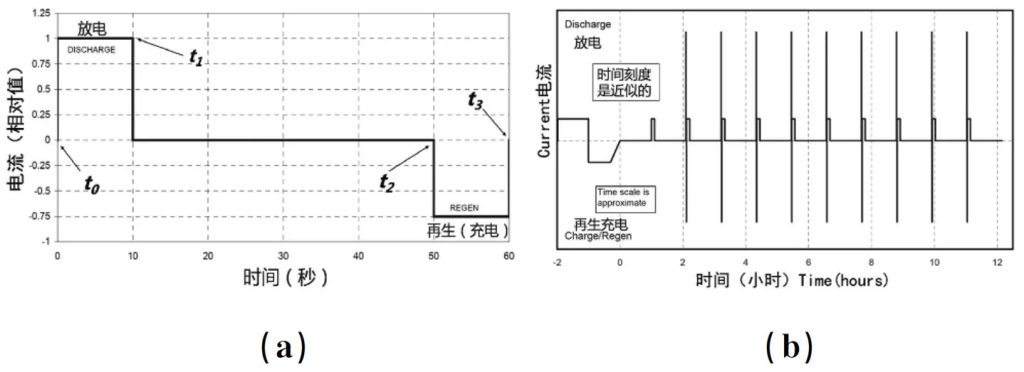
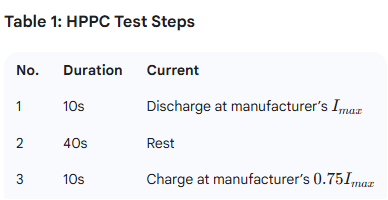
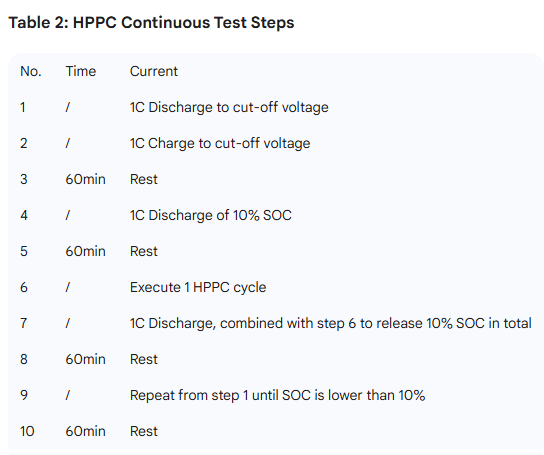
The HPPC test procedure consists of a simple repetition of the characteristic curve shown in Figure 1 (a). The test begins at a fully charged state (100% SOC). A pulse sequence is performed after every 10% DOD increment, followed by a 1-hour rest period, until the test concludes after a final 1-hour rest at 100% DOD, as illustrated in Figure 1 (b). The 1-hour rest period allows the battery to reach electrochemical and thermal equilibrium. The voltage at the end of each rest period must be recorded to establish the battery’s OCV (Open Circuit Voltage) curve. The test pulses are executed using two peak current levels: a low current (25% of Imax) and a high current (75% of Imax), where Imax is the maximum allowable 10-second pulse discharge current specified by the manufacturer.
Note: OCV (Open Circuit Voltage) is measured during the rest periods.
In essence, the HPPC test performs a pulse sequence at every 10% DOD increment, progressing from high SOC to low SOC. The intervals can be shortened based on specific system design requirements, which results in a higher-density data set (a more detailed lookup table). It is important to note that a 1-hour rest period follows each discharge step. This waiting period allows the battery voltage to return toward a steady state. In practice, however, one hour is often insufficient for the battery to reach absolute chemical or thermal equilibrium. Consequently, the SOC-OCV curve derived from these end-of-rest values should be considered a reference curve rather than an absolute steady-state curve.
The analysis of HPPC test results includes the following aspects:
Open Circuit Voltage (OCV): The voltage measured at the end of each rest period, which can be plotted as a function of DOD.
Internal Resistance Characteristics: Discharge and regenerative charging resistances are calculated from the test data. These resistances vary according to the DOD.
Pulse Power Capability: Derived from the voltage and resistance characteristics, both discharge and regenerative charging capabilities can be plotted as a function of DOD.
Available Energy: Defined as the energy deliverable by the battery system under 1C discharge conditions. It is determined by establishing the relationship between power and 1C discharge energy across different DOD levels.
Available Power: The maximum discharge power capability when the available energy reaches a specific target value.
Power and Energy Fade (Degradation): Represents the changes in available power and energy over time during system life cycle testing.
2. The detailed analysis of the HPPC test for EV Batteries results is as follows:
2.1 Open Circuit Voltage (OCV)
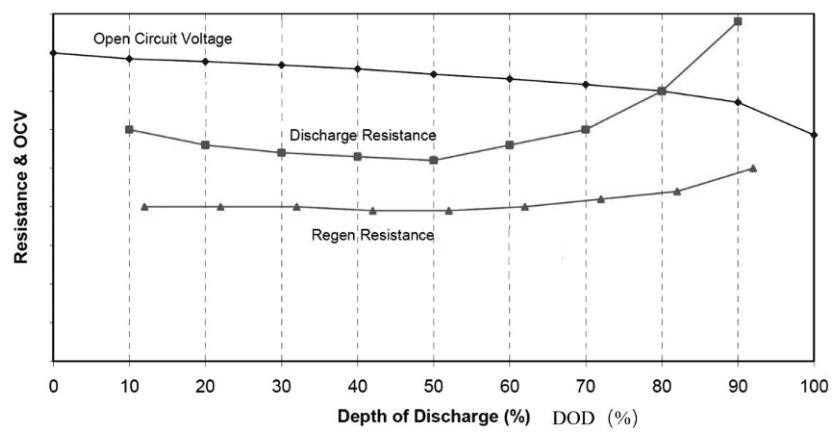
The Open Circuit Voltage (OCV) is defined as the voltage value at the end of each HPPC rest period and can be plotted as a function of the Depth of Discharge (DOD). Based on the measured data points, OCV values at other DOD levels can be estimated through linear interpolation or data fitting curves, as shown in Figure 2.
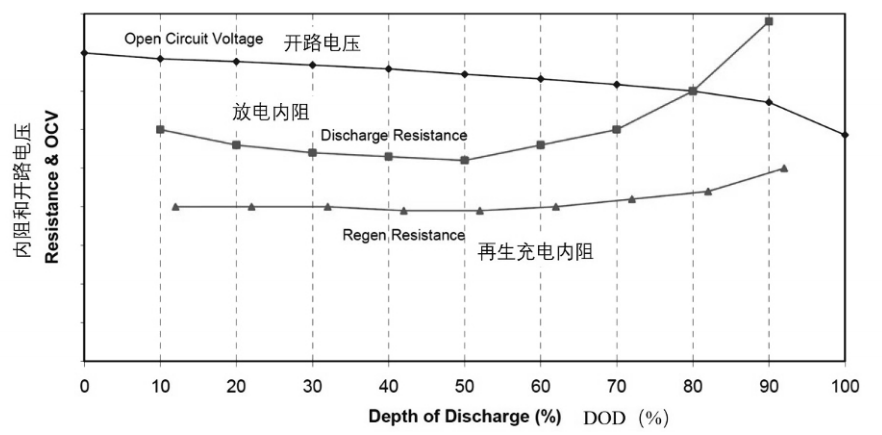
2.2 Calculation of internal resistance characteristics as a function of Depth of Discharge (DOD).
The discharge and regenerative charging resistances for each test are determined using the ΔV/ΔI calculation based on Equations (1) and (2) and Figure 1, as illustrated in Figure 2.
RDischarge = (Vt1 – Vt0) / -(It1 – It0) = (Vt1 – Vt0) / (It0 – It1) (1)
RCharge = (Vt3 – Vt2) / -(It3 – It2) = (Vt3 – Vt2) / (It3 – It2) (2)

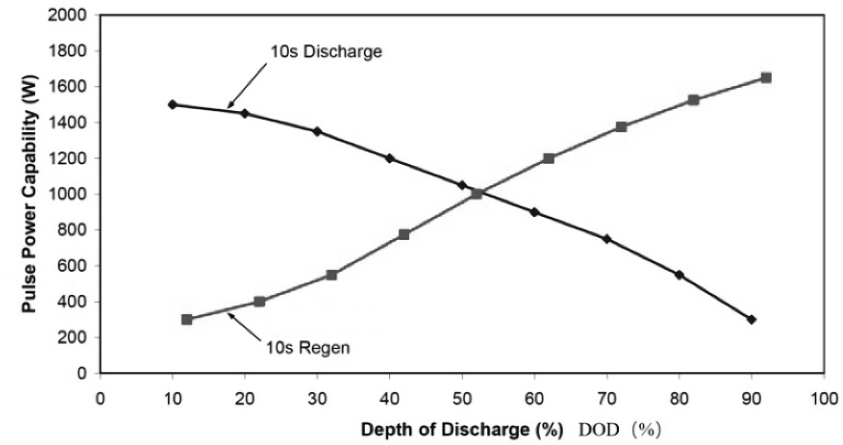
2.3 Evaluation of Pulse Power Limits
The power capability under pulse conditions is determined as a function of DOD, deriving its values from established voltage and resistance behaviors. This characterization accounts for both the discharge power sustained at Vmin and the regenerative charge power at Vmax—the critical operating voltage ceilings for the cell. By referencing the OCV and internal resistance mapped in Figure 3, the power outputs for discharge and regeneration are computed through the application of formulas (3) and (4).
PDischarge = Vmin × (OCV – Vmin) / RDischarge (3)
PCharge = Vmax × (Vmax – OCV) / RCharge (4)
These power capability values can determine the change in usable depth of discharge and energy values. An example of the relationship between power capability and DOD is shown in Figure 3. When determining DOD values, the capacity consumed by discharge pulses must be considered, resulting in a lag in the regenerative charge DOD values.
2.4 Usable energy
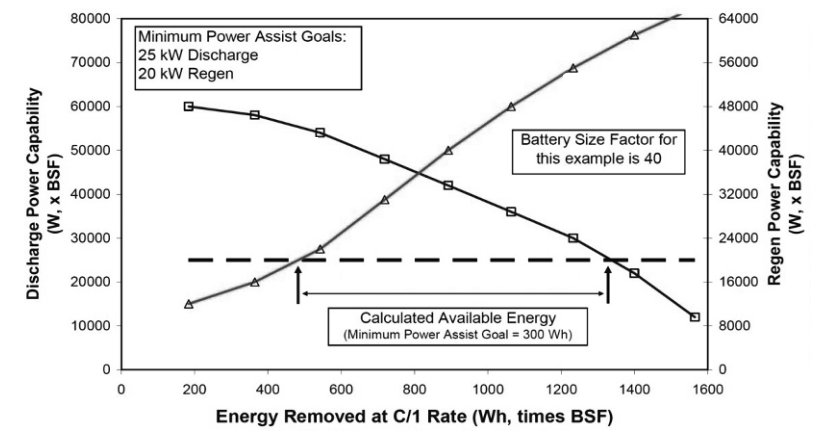
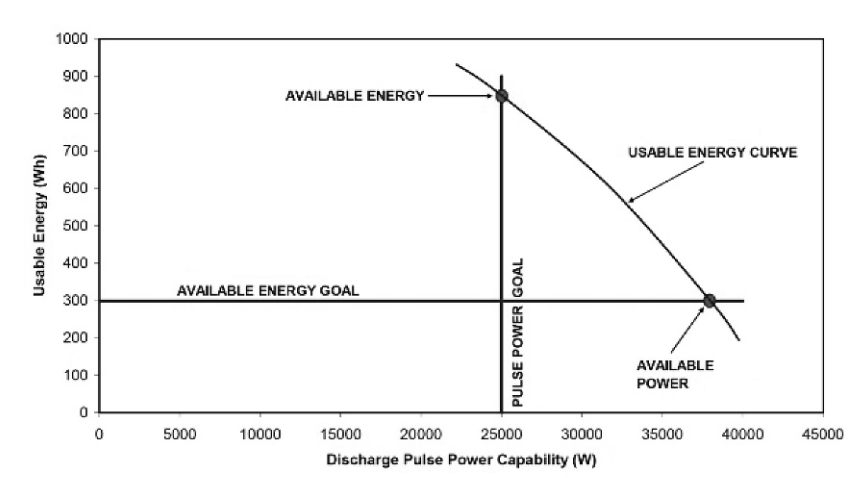
Usable energy is defined as the energy that can be obtained from a 1C discharge of the battery system. The steps to determine usable energy include: establishing the relationship between HPPC power and 1C discharge energy at different depths of discharge; using the Battery Size Factor (BSF) to scale the energy and power; determining the minimum and maximum DOD values that meet the target requirements of the test manual; and calculating the usable (1C discharge) energy over the discharge region precisely meeting the target.
As shown in Figure 4, the power-energy curve can be derived by replacing the DOD values with energy values in the 1C discharge HPPC data. The power-energy values obtained at the single-cell level can be scaled using the size factor (BSF) and compared with the FreedomCAR indicators. Figure 4 shows the magnified results using a size factor of 40. By adding a horizontal line representing the power target in the figure, the usable energy can be determined at the intersection of the horizontal line and the curve. The usable energy in Figure 4 is approximately the difference between 1330Wh and 480Wh, i.e., 850Wh. This 850Wh result exceeds the minimum power target of 300Wh by 550Wh, which is necessary at the beginning of the battery’s life because power capability and usable energy degrade over the battery’s life, and the power and energy targets must still be met at the end of life. The point at which the energy margin reduces to zero marks the end of the battery’s life.
2.5 Usable power
Usable power is the maximum discharge power capability when the usable energy meets the minimum value required by the FreedomCAR test manual. This parameter is mainly used to examine the degradation of the battery over its entire life cycle. Usable power and usable energy reflect two complementary aspects of battery performance at any given time, as shown in Figure 5.
2.6 Power and Energy Decay
For system life testing, power and energy decay rates are used. The changes in usable power and usable energy over time need to be tested periodically at specific points and expressed as a percentage of the initial (BOL) values, as shown in equations (5) and (6).
Power Decay (%) = 100 × (1 – Usable Power / Initial Usable Power) (5)
Energy Decay (%) = 100 × (1 – Usable Energy / Initial Usable Energy) (6)
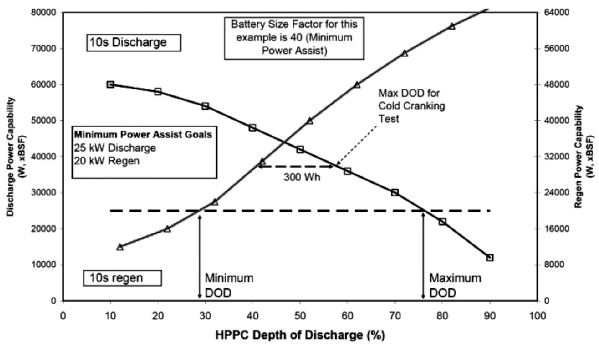
2.7 Minimum and maximum DOD values
The minimum and maximum DOD values that meet the (FreedomCAR) electric vehicle system power targets can be determined using the same HPPC data and scaling factors as in Figure 4, but plotted against the original HPPC test DOD values (without converting the horizontal axis to energy values). As shown in Figure 6, the minimum and maximum DOD values meeting the power assist targets are approximately 28% and 76%, respectively, while the maximum DOD value meeting the usable energy target is about 57%.
3.HPPC data directly empowers the core functionalities of the Battery Management System (BMS):
Precise SOC Estimation: The OCV-DOD curve serves as a critical compensation reference for the Coulomb Counting method. Particularly in the flat voltage plateau region (20%–80% SOC) of Lithium Iron Phosphate (LFP) batteries, it can reduce estimation errors to within ±3%.
SOH Health Assessment: An internal resistance increase of >20% or an available energy fade of >15% marks the End of Life (EOL), triggering the BMS early-warning mechanisms.
Model Parameter Calibration: HPPC provides essential parameters for Equivalent Circuit Models (ECM), such as the Thevenin Model. By identifying Ohmic resistance (R0), polarization resistance (Rp), and polarization capacitance (Cp), it significantly enhances state prediction accuracy.
Fault Diagnosis: Anomalous internal resistance fluctuations (e.g., a sudden surge in polarization resistance at low temperatures) help identify over-discharge, over-charge, or low-temperature damage, supporting BMS active current limiting.
4. Critical Support for Thermal Management: The Core Basis for Controlling Temperature Rise and Uniformity
Battery heat generation primarily stems from Joule heating due to internal resistance. HPPC data directly drives the thermal management design:
Heat Quantization & Cooling Requirements: By using DCIR to calculate peak heat generation power under US06 high-speed driving cycles, the minimum flow rate for the liquid cooling system is determined (e.g., a cell-level heat of 3.29W requires a flow rate of ≥ 8 L/min).
Temperature Uniformity Optimization: The DOD-resistance relationship revealed by HPPC indicates that internal resistance escalates at high DOD levels (DCIR can increase by 50% at 80% DOD). This necessitates targeted cooling channel designs, such as segmented variable cross-section channels, to maintain module temperature gradients below 5°C.
Thermal Simulation Model Validation: The resistance-temperature relationships provided by HPPC are input into CFD software (e.g., Ansys Twin Builder) to predict temperature distribution across various operating conditions, achieving an error margin of <5%.
5. Conclusion: The Pivotal Role of HPPC Throughout the Battery Life Cycle
The HPPC test is far more than a mere “diagnostic report” of battery performance; it serves as the fundamental data engine driving both BMS algorithms and thermal management architectures:
For the BMS: It establishes the gold standard for SOC and SOH estimations, ensuring high-fidelity state awareness and robust control of safety boundaries.
For Thermal Management: It quantifies the patterns of impedance-induced heat generation, providing the essential blueprint for cooling system designs that achieve temperature uniformity and maximize cycle life.
Industry Application: From the FreedomCar manual to China’s “863” Program, HPPC has evolved into a mandatory testing benchmark for battery R&D, automotive-grade validation, and second-life (cascade) utilization assessments.
Source: Xie Leqiong, et al., “Key Testing Methods for Traction Batteries: Hybrid Pulse Power Characterization (HPPC) Test.”
Due to the limited knowledge and English level is inevitable errors and omissions, if there are errors or infringement of the text, please contact me as soon as possible by private letter, I will immediately be corrected or deleted.