Why is your CV curve asymmetrical? This article provides a detailed introduction to the fundamental principles and applications of Cyclic Voltammetry (CV). It analyzes the symmetry of CV curves, specifically focusing on peak potential separation and peak current ratios, while exploring the underlying causes of asymmetry—such as quasi-reversible and irreversible reactions, coupled chemical reactions, and diffusion- versus adsorption-controlled processes. Finally, the article discusses the practical applications of CV curve asymmetry in evaluating catalyst activity, battery rate performance, and the capacitive characteristics of supercapacitors.
What is cyclic voltammetry (CV)? Neware battery cyclers 8002 with CV
Cyclic Voltammetry (CV) involves applying a cyclic potential that varies linearly with time to a working electrode within a typical three-electrode system (comprising a working electrode, a reference electrode, and a counter electrode), while simultaneously measuring the current flowing through the working electrode.
The applied potential serves as the “driving force,” controlling the oxidation or reduction of electroactive species at the electrode surface, whereas the measured current is a direct manifestation of the reaction rate. When the potential reaches the characteristic redox potential of a specific species, a Faradaic current is generated, resulting in the formation of peaks on the current-potential plot (Figure 1).
What is CV curve symmetry?
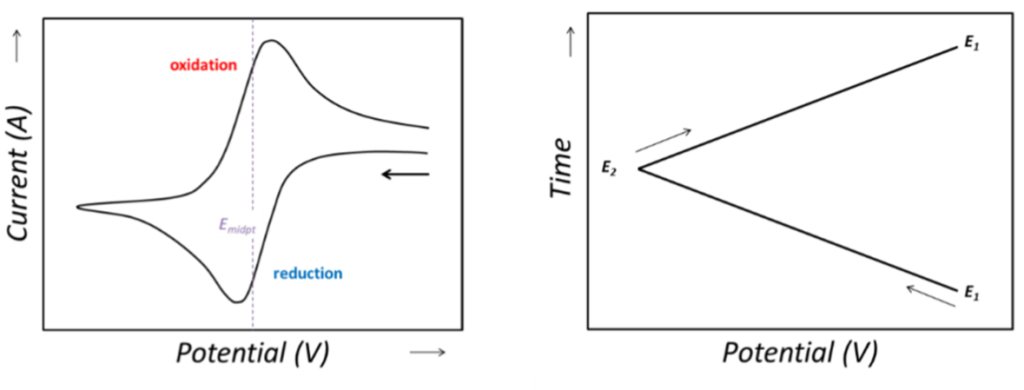
To understand “asymmetry,” one must first define “symmetry.” In an ideal state, a CV curve exhibits a pair of morphologically symmetrical oxidation and reduction peaks (Figure 2).
Anodic Peak Potential (Epa) and Cathodic Peak Potential (Epc): These correspond to the potentials at which the rates of the oxidation and reduction reactions reach their maximum, respectively.
Anodic Peak Current (Ipa) and Cathodic Peak Current (Ipc): These correspond to the maximum currents recorded during the oxidation and reduction processes.
For an ideal, single-electron transfer reversible system at 298 K (25°C), symmetry is reflected in two core indicators:
Peak Potential Separation (Delta Ep = |Epa – Epc|): The theoretical value should be approximately 59 mV. This value directly reflects the thermodynamic reversibility of the electrochemical reaction.
- Peak Current Ratio (|Ipa/Ipc|): The theoretical value should be equal to 1. This indicates that the species consumed during the oxidation process can be completely regenerated during the reduction process (and vice versa), reflecting the chemical stability of the electroactive species.
Any deviation from the two aforementioned ideal values—whether it be an increase in peak potential separation, a peak current ratio deviating from unity, or a distortion of the overall curve profile—constitutes the “asymmetry” of the voltammogram.
Why is the CV curve asymmetrical in shape?
The asymmetry of CV curves serves as a key to deciphering electrochemical reaction kinetics, coupled chemical reactions, and complex interfacial processes. This asymmetry can be analyzed primarily through three dimensions: peak potential, peak current, and overall peak shape.
Peak potential asymmetry: ΔEp deviates from the ideal value
The expansion of the peak potential difference (ΔEp) is the primary indicator for judging the reaction kinetics, as it directly reflects the speed of the electron transfer step.
1) Quasi-reversible systems
When ΔEp is greater than 59/n mV, but a pair of redox peaks can still be clearly observed, the system is called “quasi-reversible.” This indicates that the electron transfer rate is limited and can no longer fully keep up with the potential scan rate, leading to the need to apply a larger overpotential to drive the reaction.
In this case, ΔEp will further increase with increasing scan rate because faster scan rates place higher demands on the electron transfer rate (Figure 3).
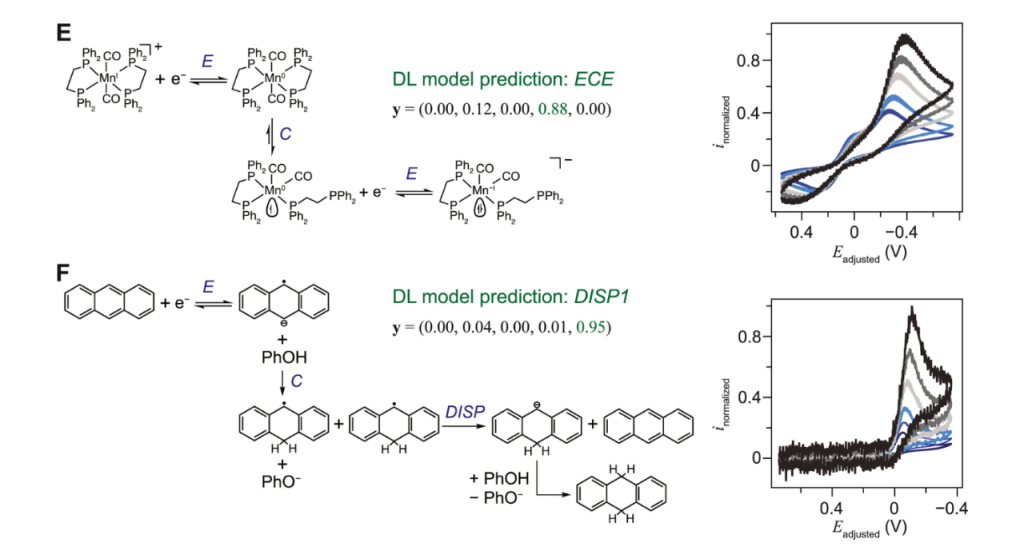
2) Irreversible Systems
When ΔEp becomes very large, even to the point that the corresponding peak is not observed at all in the reverse scan, the system is considered “irreversible.” In this case, the electron transfer step is very slow, or the products of the electrode reaction are extremely unstable and are consumed through other pathways before reaching their reaction potential in the reverse scan (Figure 3).
For purely kinetically irreversible systems, the CV curve typically shows only one peak (oxidation or reduction), and the potential of this peak shifts significantly with increasing scan rate.
Peak current asymmetry (|Ipa/Ipc|≠1)
When |ipa/ipc| is not equal to 1, it usually indicates a chemical transformation of the electrode reaction products, i.e., a chemical coupling reaction.
EC Mechanism: After the electrode reaction (E) occurs, its products immediately undergo an irreversible chemical reaction (C).
Consider a reduction process: O + ne → R (E), followed by the decomposition of product R into Z (R → Z, C). In the forward scan, we observe the cathode peak (ipc) where O is reduced to R. However, because R decomposes rapidly, by the time the potential is reversed to a potential range sufficient to oxidize R back to O, the concentration of R at the electrode surface has significantly decreased.
Therefore, the anodic peak current (ipa) will be much smaller than the cathode peak current (ipc), i.e., |ipa/ipc| < 1. If the rate of chemical reaction C is very fast, the anodic peak may even disappear completely (Figure 4).
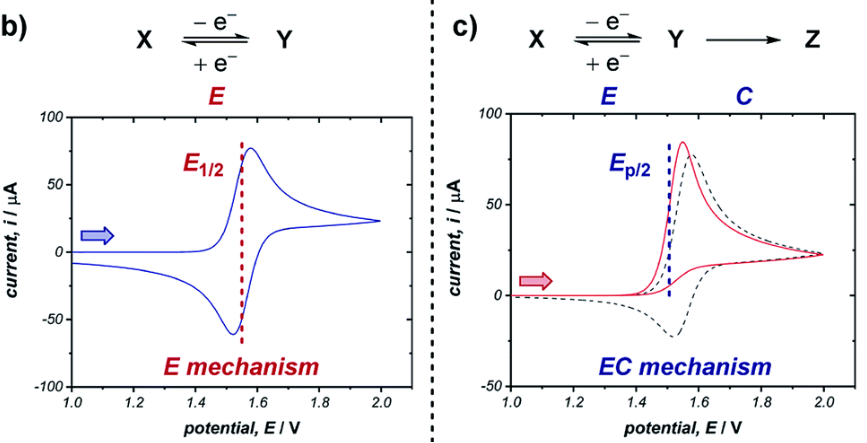
This phenomenon is extremely common in organic electrochemistry and electrocatalysis, such as the initiation step of electropolymerization reactions or the rapid quenching of certain intermediate free radicals. By studying the change of |ipa/ipc| with scan rate, it is even possible to estimate the rate constant of chemical reaction C.
Peak shape asymmetry and distortion
Ideally, diffusion-controlled peaks are relatively broad and flat, whereas peaks originating from surface-adsorbed species are typically sharper, more symmetrical, and have a narrower peak width. In adsorption-controlled processes, the peak current (ip) is directly proportional to the scan rate (ν) (ip ∝ ν), rather than the square root of the scan rate (ν^(1/2)) observed in diffusion-controlled systems.
When both diffusion and adsorption coexist in an electrochemical process, the CV curves exhibit hybrid characteristics. This often manifests as a sharp adsorption peak superimposed on a broad diffusion peak, resulting in significant asymmetric distortion (Figure 5).
Furthermore, small peaks or shoulder peaks appearing before or after the main redox peak usually indicate multi-step electron transfer processes or the presence of multiple active sites with different energy states on the electrode surface. These small peaks are important indicators for analyzing surface heterogeneity when studying heterogeneous catalysts or modified electrodes.
Application
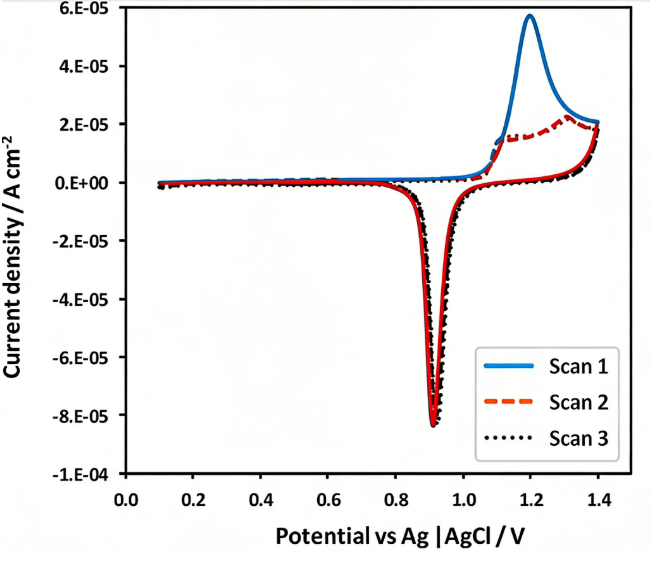
For catalytic processes such as oxygen reduction reaction (ORR) or hydrogen evolution reaction (HER), the asymmetry of the CV curve (e.g., onset potential, peak position, peak shape) is directly related to the catalyst’s activity and selectivity.
For example, when evaluating porous carbon-based catalysts, the degree of distortion of the CV curve at high scan rates can be used to assess its mass transfer performance. An excellent catalyst should ensure that reactants and products can rapidly enter and exit active sites even at high current densities (Figure 6).
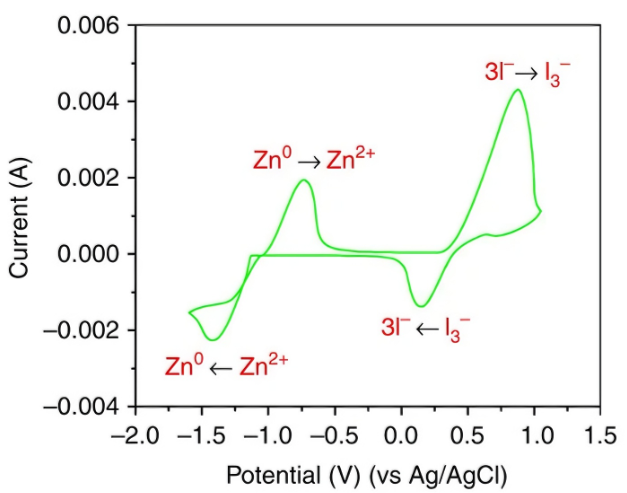
The CV curves of battery materials typically exhibit distinct, nearly symmetrical Faraday peaks, and their ΔEp value is crucial for evaluating the material’s rate performance (reaction kinetics). A smaller ΔEp indicates less polarization during charging and discharging, higher energy efficiency, and stronger fast charge/discharge capability (Figure 7).
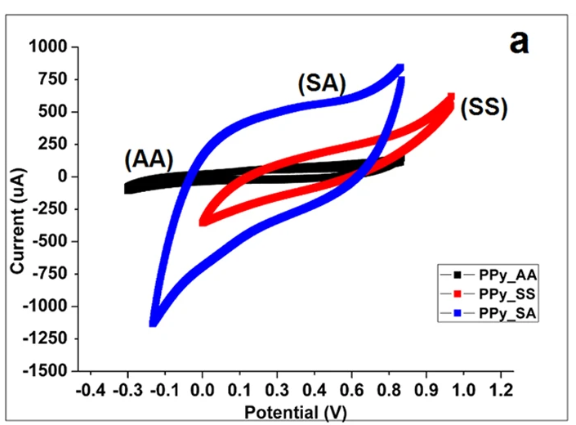
In supercapacitor research, more attention is paid to the degree of deviation between the CV curves and an ideal rectangle. A higher degree of rectangularity indicates purer electric double-layer capacitance (EDLC) characteristics and lower internal resistance. The presence of redox peaks is utilized to quantitatively analyze the contribution of pseudocapacitance, which is crucial for designing hybrid supercapacitors with high energy density (Figure 8).