
Insights from “Lithium Battery Frontier” – 锂电前沿
Abstract:
Anode symmetric cells were assembled using two identical electrodes, one in a lithium state and another one in a delithiated or pristine state. The charging-discharging regime of graphite symmetric cells were studied. And the electrochemical impedance spectrum of different state of charge(SOC)was also analyzed. A sloping curve from -1 V to 0.5 V was only observed during the first charging curve of the 100% SOC-Pristine graphite symmetric cell. The voltage platform was suggested to the formation of SEI layer in the pristine graphite surface. The impedance of symmetric cell in 0% SOC and 100% SOC reached the maximum. While the impedance achieved the minimum value in 50% SOC.
Key Words:
Li-ion battery; Anode symmetric cells; SEI layer; Impedance;
1. Introduction: Why Use Symmetric Cells for Battery Research?
The inevitable capacity fading of lithium-ion batteries (LIBs) during the initial formation (first charge), storage, and long-term cycling increases costs and restricts their wider application. A lithium-ion battery is a highly complex system; the degradation of capacity does not stem from a single factor but is rather a multi-factorial, interactive, and simultaneous process. Consequently, isolating and distinguishing these individual degradation mechanisms remains a significant challenge.
Symmetric cells, which consist of two identical electrodes in a single-layer laminated configuration, have traditionally been utilized for Electrochemical Impedance Spectroscopy (EIS) studies rather than in-depth performance analysis. However, recent research has successfully employed symmetric cells—composed of one lithiated electrode and one delithiated electrode—for cycling tests to evaluate the intrinsic performance of lithium-ion battery components.
Compared to half-cells (lithium-metal counter electrode), symmetric cells operate with limited lithium transport, preventing the interference of excessive lithium. Furthermore, symmetric cells avoid the complex side reactions that occur between the electrolyte (or electrolyte additives) and the lithium foil.
This study utilizes graphite symmetric cells to investigate anode degradation. Due to the narrow operating voltage window of these symmetric cells, oxidation of the electrolyte under high-voltage conditions is effectively suppressed, allowing for a more accurate assessment of anode stability.
2. Experimental Section: Preparation and Testing of Symmetric Cells
2.1 Preparation of Anode Symmetric Cells (100% SOC vs. Pristine)
The electrode materials used in this study are double-sided coated cathode and anode materials. The cathode is NCM622, and the anode is artificial graphite. First, N-Methyl-2-pyrrolidone (NMP) was used for the cathode and deionized water was used for the anode to wipe off one side of the electrode. Then, the electrodes underwent punching, drying, and tab welding, and were assembled into single-layer pouch cells, followed by electrolyte injection and sealing.
One full cell was charged to a fully charged state, while another was discharged to a fully discharged state. Both cells were disassembled to extract the lithiated graphite anode and the delithiated graphite anode, respectively. Dimethyl Carbonate (DMC) was used to rinse the electrodes to remove residual electrolyte. After the electrodes were dry, the lithiated anode and the delithiated anode were assembled into an anode symmetric cell (defined as a 100% SOC-0% SOC symmetric cell).
For comparison, another anode symmetric cell was assembled using a lithiated anode and a pristine anode (defined as a 100% SOC-Pristine symmetric cell). Both the cell disassembly and the symmetric cell assembly were completed in a dry room. For descriptive convenience, the lithiated graphite is defined as the cathode, while the delithiated or pristine graphite is defined as the anode.
2.2 Performance Testing Protocols for Symmetric Cells
Electrical Performance Testing: The full cells were subjected to charge and discharge experiments using a battery tester. The cells underwent one cycle of galvanostatic charge/discharge at a 0.05C rate, followed by two cycles at 0.1C within a voltage range of 3V-4.2V. The fully charged cell was charged at 1C using a constant current-constant voltage (CC-CV) protocol to 4.2V with a cut-off current of 0.05C. The fully discharged cell was discharged at 1C to 3V, then at 0.1C to 3V, and finally at 0.01C to 3V. The anode symmetric cells were charged and discharged at a 0.05C rate within a voltage range of -2V to 2V.
Electrochemical Impedance Spectroscopy (EIS) was tested using a potentiostat and an impedance/gain-phase analyzer.
3. Results and Discussion: Decoupling Degradation via Symmetric Cells
3.1 Comparative Analysis of Charge/Discharge Curves in Symmetric Cells
Figure 1 shows the charge/discharge curves of the 100% SOC-Pristine and 100% SOC-0% SOC anode symmetric cells at different cycle numbers. In the first cycle of the 100% SOC-Pristine anode symmetric cell, a plateau appears during charging between -1V and -0.5V. In contrast, no plateau is observed within this voltage range for the 100% SOC-0% SOC anode symmetric cell. This phenomenon is attributed to the formation of the Solid Electrolyte Interphase (SEI) film on the pristine graphite anode during the initial charging process.
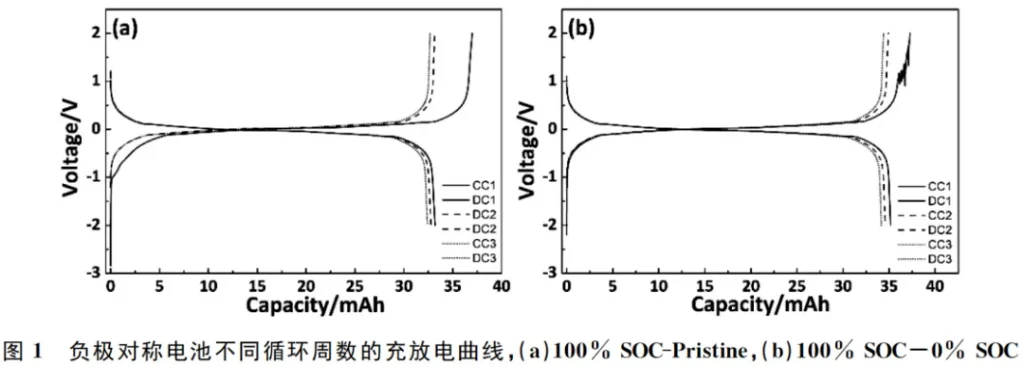
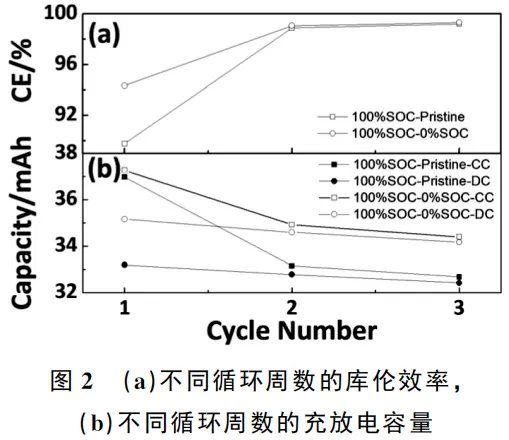
As illustrated in Figure 2(a), the initial coulombic efficiency (ICE) of the 100% SOC-Pristine anode symmetric cell is lower than that of the 100% SOC-0% SOC anode symmetric cell. This indicates that the pristine graphite anode consumes a greater amount of active lithium to form the Solid Electrolyte Interphase (SEI) film during the initial charging process. As cycling progresses, the coulombic efficiencies (CE) of both the 100% SOC-Pristine and 100% SOC-0% SOC anode symmetric cells tend to converge; however, they remain below 1.0, accompanied by a decrease in charge/discharge capacity, as shown in Figure 2(b).
Researchers generally categorize the capacity fading during full-cell cycling into several primary mechanisms: the formation and repair of the SEI film, electrolyte oxidation, dissolution of transition metals from the cathode, and structural degradation of the cathode. In the graphite symmetric cells used in this study, cathode-related factors such as transition metal dissolution and structural damage are eliminated.
Furthermore, due to the narrow voltage window, electrolyte oxidation is negligible. Consequently, the capacity loss in the graphite symmetric cells is primarily caused by the loss of active lithium resulting from the continuous formation and repair of the SEI film during cycling.
3.2 dQ/dV Characterization: Identifying SEI Formation in Symmetric Cells
The dQ/dV method is an in-situ electrochemical analytical technique used to analyze changes in the battery’s open-circuit voltage (OCV) curves. Each peak on the dQ/dV curve corresponds to a two-phase coexistence region, thereby revealing subtle changes in the voltage profile that are otherwise difficult to detect. By differentiating the voltage-capacity curves shown in Figure 1, the dQ/dV curves for various cycle numbers were obtained, as illustrated in Figure 3.
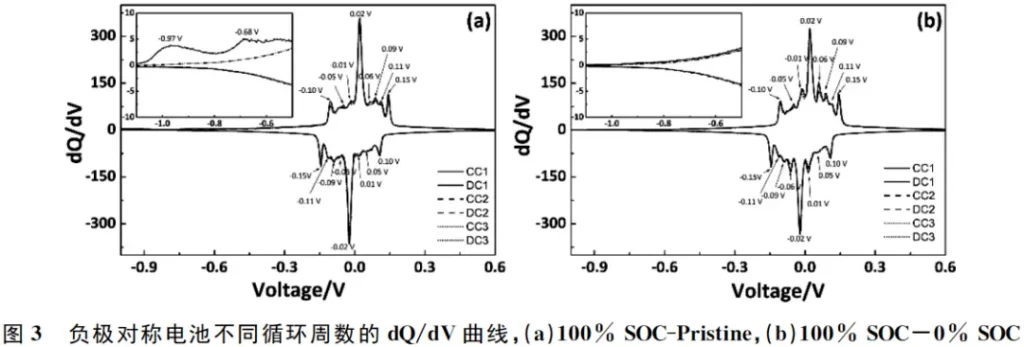
The 100% SOC-Pristine anode symmetric cell exhibits two minor peaks at -0.97V and -0.68V during the initial charge, which are absent in the 100% SOC-0% SOC anode symmetric cell. These two peaks are associated with the formation of the SEI film on the surface of the pristine graphite. During subsequent cycling, both the 100% SOC-Pristine and 100% SOC-0% SOC anode symmetric cells display eight distinct peaks during the charging process, located at -0.10V, -0.05V, -0.01V, 0.02V, 0.06V, 0.09V, 0.11V, and 0.15V, respectively. Correspondingly, eight peaks are observed during the discharge process at 0.10V, 0.05V, 0.01V, -0.02V, -0.06V, -0.09V, -0.11V, and -0.15V.
The symmetry between the charge and discharge dQ/dV peaks indicates that each reaction is a highly reversible process, resulting from the superposition of various lithium intercalation/de-intercalation stages in the graphite.
3.3 EIS Evolution: SOC-Dependent Impedance in Symmetric Cells
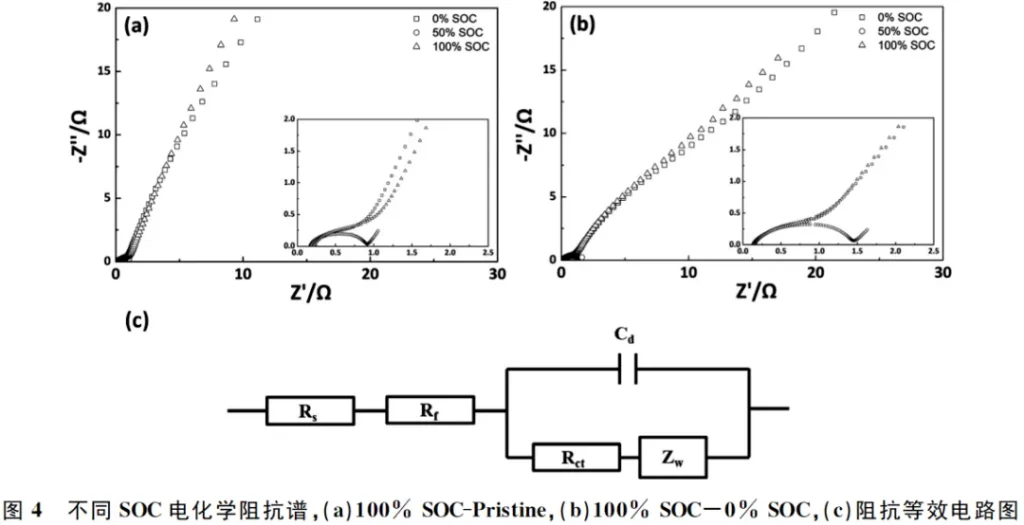
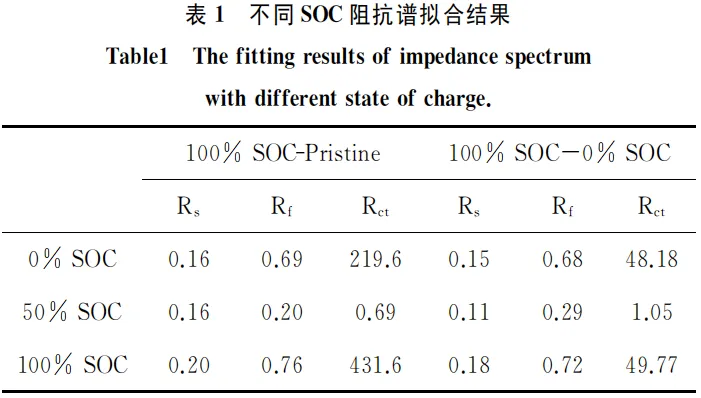
The Electrochemical Impedance Spectroscopy (EIS) of the anode symmetric cells at various States of Charge (SOC) is shown in Figure 4. Combined with the data in Table 1, it is evident that the ohmic resistance (Rs) remains relatively constant regardless of the SOC. In contrast, the film resistance (Rf) and charge transfer resistance (Rct) are strongly dependent on the state of charge. The impedance values at the fully discharged (0% SOC) and fully charged (100% SOC) states are similar and reach their maximum, whereas the impedance at the half-charged state (50% SOC) is at its minimum.
In both the 0% SOC and 100% SOC anode symmetric cells, at least one electrode is in a fully discharged state. Since the anode impedance typically exhibits a sharp increase at low SOC, the overall impedance results show significant fluctuations. However, in the 50% SOC state, both anode electrodes are in a half-charged condition, resulting in the most stable impedance profile.
4. Conclusion: The Strategic Value of Symmetric Cells in Degradation Analysis
This study utilizes anode symmetric cells to analyze the charge/discharge mechanisms of graphite symmetric cells. Based on the analysis of the charge/discharge profiles and dQ/dV curves, two minor peaks were observed at -0.97V and -0.68V during the initial charge of the 100% SOC-Pristine anode symmetric cell. These peaks, which are absent in the 100% SOC-0% SOC anode symmetric cell, are directly associated with the formation of the SEI film on the fresh graphite surface. Correspondingly, the Coulombic Efficiency (CE) of the 100% SOC-Pristine anode symmetric cell is lower than that of the 100% SOC-0% SOC version initially, though both values tend to converge as cycling continues.
Furthermore, the impedance of the anode symmetric cell is highly dependent on its State of Charge (SOC); impedance reaches its maximum at the fully discharged and fully charged states and its minimum at the half-charged state (50% SOC).
This article aims to introduce a methodology for analyzing lithium-ion battery degradation using anode symmetric cells; further in-depth research is currently ongoing.
文献参考:彭文,王蓉蓉,朱振东,杨刘倩,张峥.基于负极对称电池分析电池容量损失[J].电池工业,2020(2):80-83