Thermal Runaway Propagation Characteristics
The peak temperature during thermal runaway of NMC811 batteries (899°C) is significantly higher than that of LFP batteries (524°C). In addition, the thermal runaway propagation speed of NMC811 batteries is five times that of LFP batteries. This indicates that NMC811 batteries require additional safety measures, such as inter-cell spacing and thermal barriers, to meet safety standards.Gas Emission
The gas volume, gas flow rate, and gas temperature released by NMC811 batteries during thermal runaway are all higher than those of LFP batteries. This requires the use of ventilation channels or high-temperature-resistant potting materials in NMC811 battery modules to isolate vented gases and avoid increased heat input, abrasion, and arcing risks.Battery Damage
NMC811 modules exhibit higher risks of damage severity, material ejection, and side-wall rupture than LFP modules. Therefore, structurally reinforced potting materials or high-temperature-resistant materials (such as steel battery casings) are recommended to maintain the mechanical integrity of NMC811 batteries and ensure unobstructed vent gas discharge. Due to their high nickel content, NMC811 batteries feature higher energy density. As shown in Figure 1, compared with LFP batteries, NMC811 batteries provide 32% higher gravimetric energy density and 37% higher volumetric energy density. In terms of safety, LFP batteries perform excellently and are less prone to overheating, combustion, and other hazardous conditions, benefiting from the stability and thermal resistance of their cathode materials. To compare their thermal runaway propagation processes, CATL NMC811 and LFP batteries were selected for this study. Detailed specifications are listed in Table 1:- NMC811 battery: 213 Wh/kg, 549 Wh/L, 96 Ah
- LFP battery: 164 Wh/kg, 373 Wh/L, 160 Ah
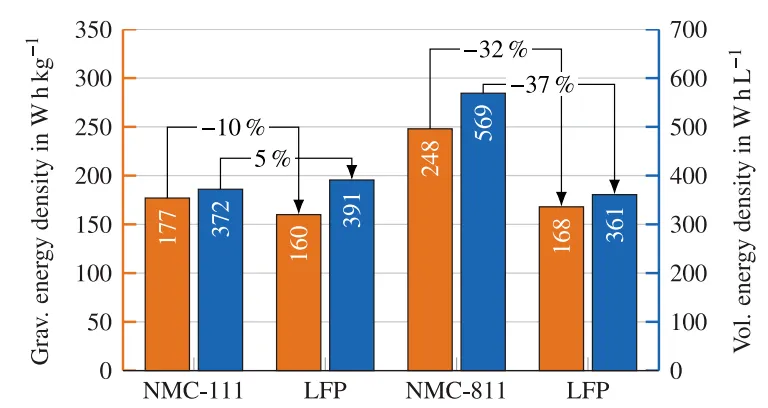
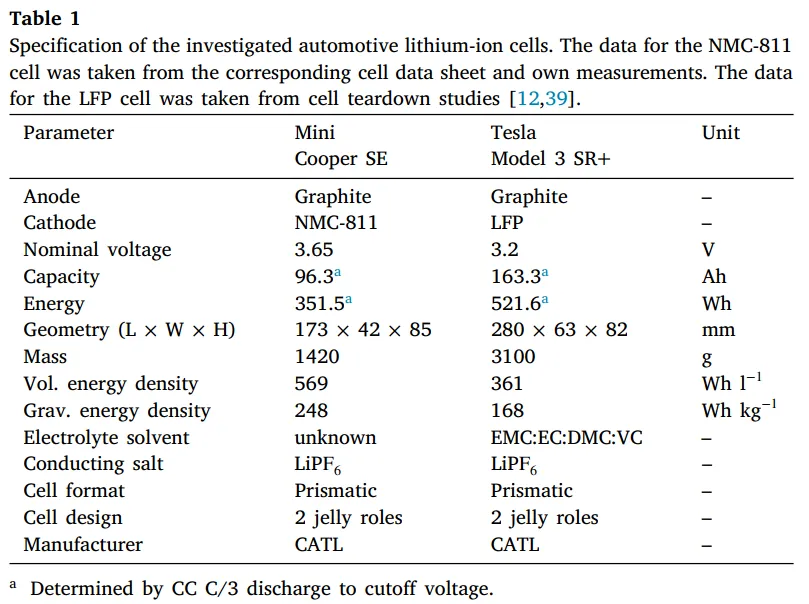
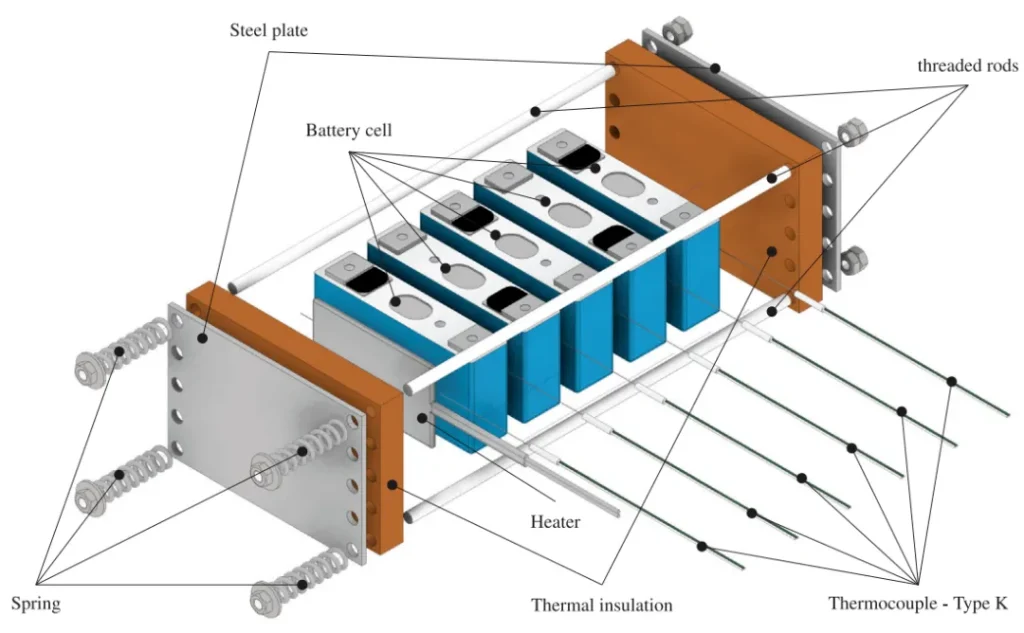
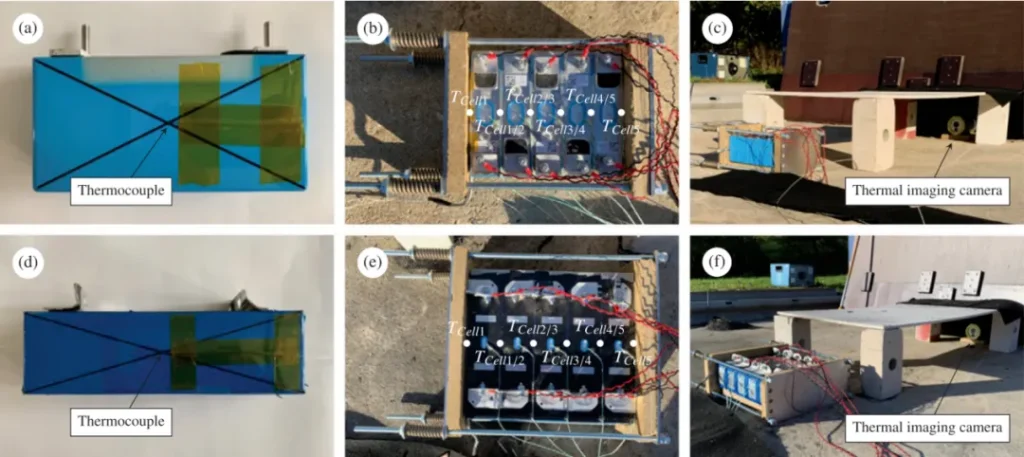
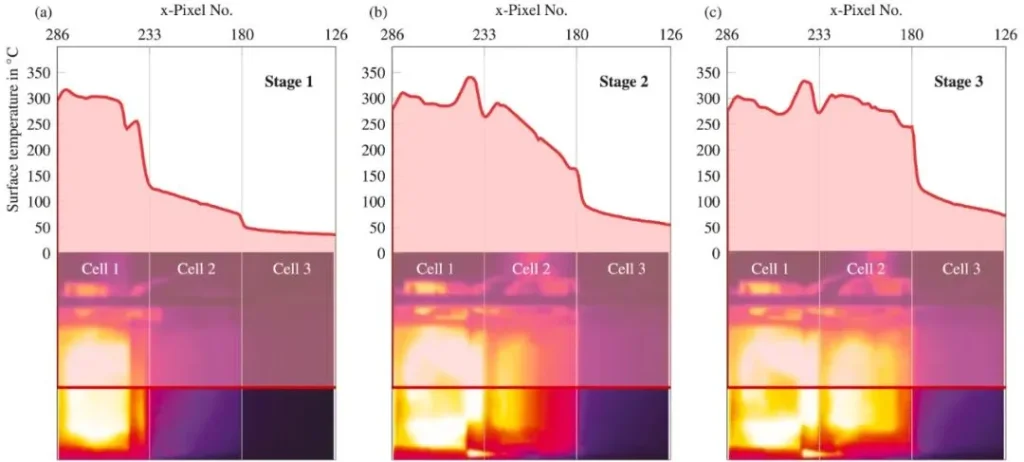
Figure 4 shows the measured data of thermal runaway propagation in batteries, mainly including temperature and voltage. Blue and green represent internal temperatures between cells, while gray represents the surface temperature of the module.The start time of the heating plate heating stage is set as . The onset of thermal runaway propagation is defined as the point when heating ends and temperature rises abruptly. The NMC811 module reached this point at a surface temperature of 371.6 °C. In contrast, thermal runaway in the LFP battery occurred much later, at 436.6 °C.
Due to unilateral heating, a temperature gradient was generated across the cells. For the NMC811 module, the front temperature was 371.6 °C and the rear temperature was 33.9 °C; thermal runaway initiated as the energy balance between internal heat generation and dissipation within the cell was disrupted. The LFP battery entered thermal runaway at a front temperature of 436.6 °C and a rear temperature of 41.6 °C.
The average peak temperature of the NMC811 battery was 899.3 °C, significantly higher than the 524.4 °C of the LFP battery.
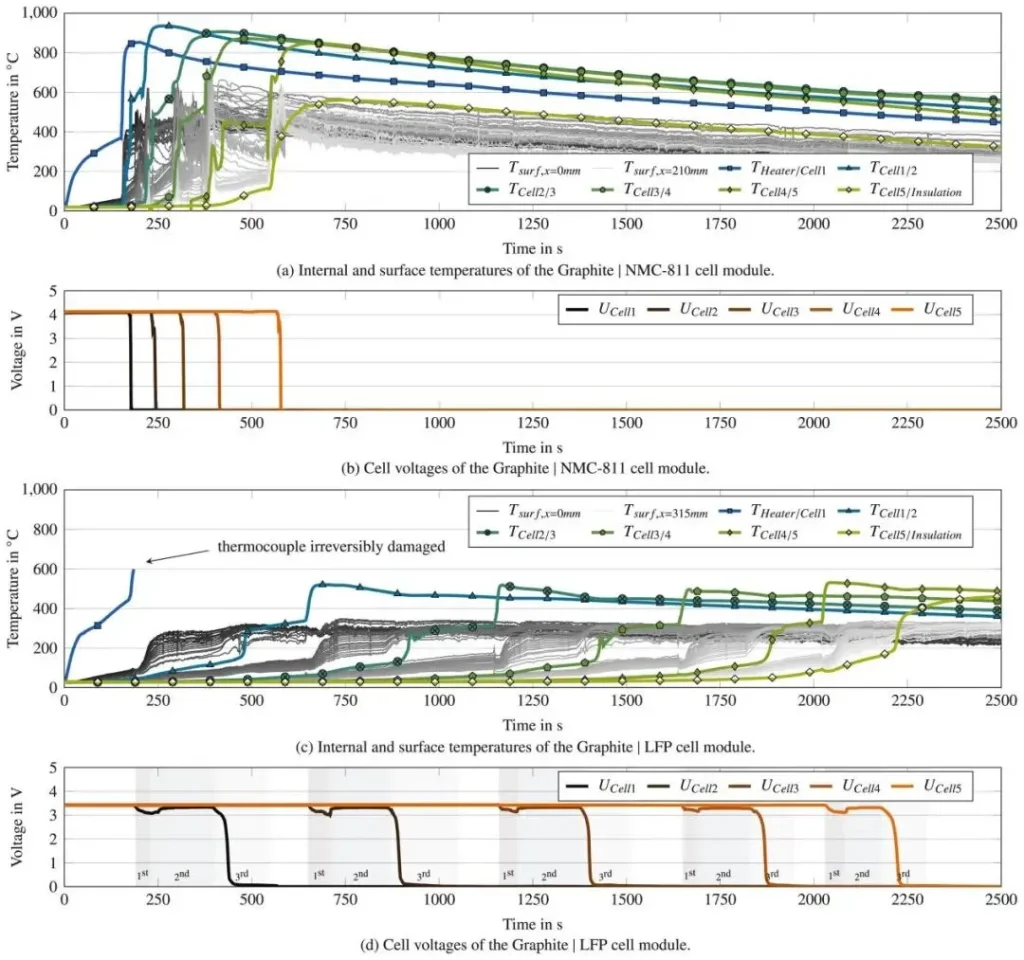
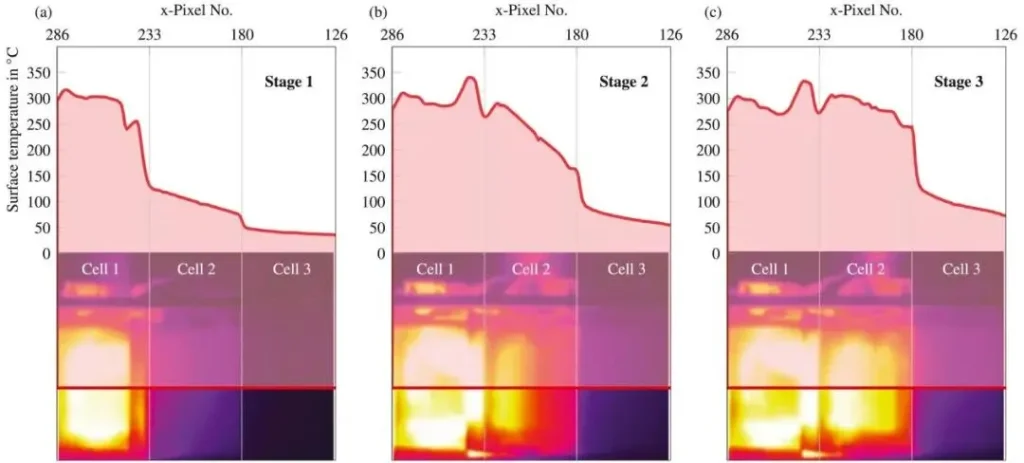
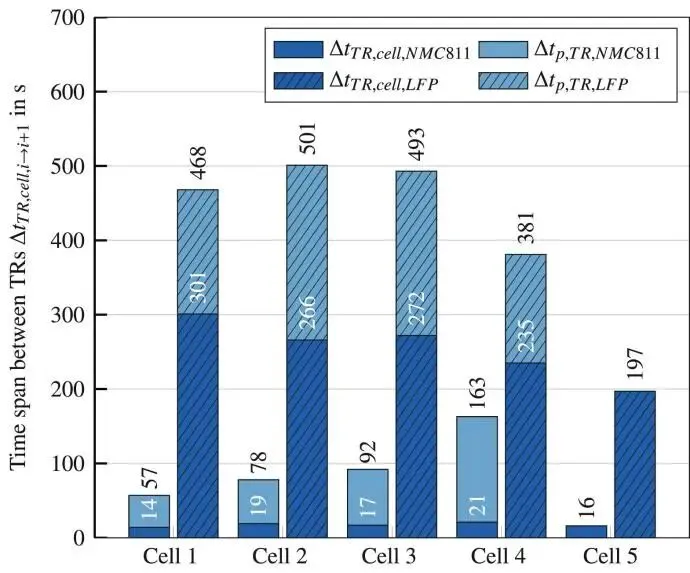
Figure 6 shows the time interval between thermal runaway events and their components for the two types of batteries.For LFP batteries, the time interval between thermal runaway events is distributed around an average value of 460 seconds, and the thermal runaway reaction time is distributed around an average value of 254.2 s.For NMC811 batteries, the time interval between thermal runaway events increases exponentially, and the thermal runaway reaction time of NMC811 batteries is distributed around an average value of 17.4 s.
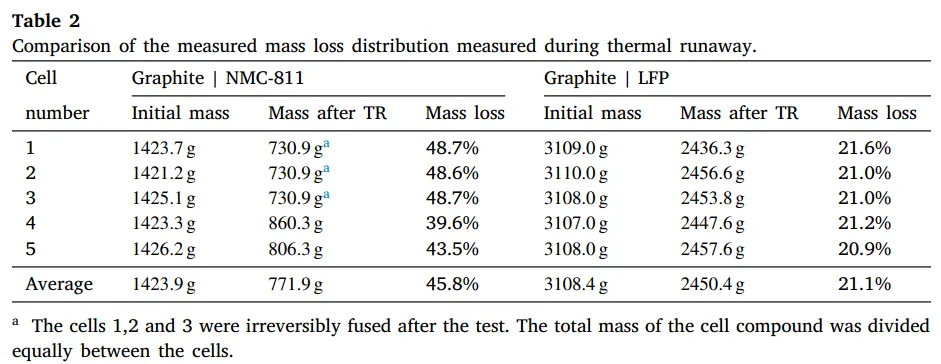
Analysis of thermally runaway batteries shows that the mass loss of NMC811 batteries ranges from 39.6% to 48.7%, which reduces their mechanical integrity and the clamping force between cells, resulting in higher thermal contact resistance and slower thermal propagation. In contrast, LFP batteries maintain their mechanical integrity with significantly lower mass loss, ranging from 20.9% to 21.6%.
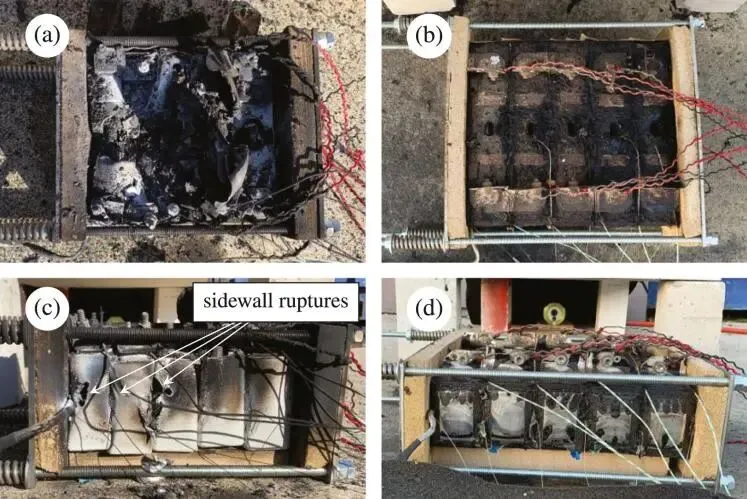
From the images of the NMC‑811 battery module after testing, significant deformation of the cell casing and damage to the cell cover can be observed. Combined with 45.8% material ejection, this resulted in the loss of mechanical integrity.
Although initial venting occurred through the safety valve, sidewall rupture also took place due to temperatures exceeding the melting point of the aluminum cell casing. In contrast, LFP batteries released gas only through the safety valve, with no obvious sidewall rupture.