
When I asked Google Gemini how to Measure Li-ion Transference Number and Ionic Conductivity, its reply was:
1. Ionic Conductivity Testing (EIS Method)
Ionic conductivity is typically measured using Electrochemical Impedance Spectroscopy (EIS) with a symmetric cell (e.g., Stainless Steel/Electrolyte/Stainless Steel).
Method: EIS at Open Circuit Potential (OCP).
Frequency Range: 1 MHz to 1 Hz (The high-frequency intercept on the real axis represents the bulk resistance, Rb.).
Amplitude: 5 mV to 10 mV.
Calculation: sigma = L / (Rb x S), where L is the electrolyte thickness and S is the electrode contact area..
Key Parameters: Precise temperature control is essential as conductivity is highly temperature-dependent.
More: What is EIS test in battery field?
In the battery field, EIS (Electrochemical Impedance Spectroscopy) is a powerful, non-destructive diagnostic tool used to “peek” inside a battery to understand its internal physical and chemical processes.
Think of it like a medical stress test: instead of cutting the battery open, you apply a small electrical signal and see how the battery reacts across different speeds (frequencies).
1. How It Works
During an EIS test, a small alternating current (AC) or voltage signal is applied to the battery across a wide range of frequencies (typically from 1 MHz down to 0.01 Hz).
The battery resists this signal in different ways depending on the frequency:
High Frequencies: Reveal the resistance of the liquid electrolyte and metal components.
Medium Frequencies: Reveal the “sluggishness” of the chemical reactions at the electrode surface (charge transfer).
Low Frequencies: Reveal how fast ions are moving (diffusing) through the material.
2. The Nyquist Plot: Reading the “Signature”
The most common way to visualize EIS data is through a Nyquist Plot. It usually looks like a series of semicircles followed by a diagonal line:
The Intercept (Ohmic Resistance, $R_s$): Where the curve starts on the left. This tells you how conductive your electrolyte and tabs are.
The Semicircle (Charge Transfer Resistance, $R_{ct}$): The width of the “hump” represents how hard it is for electrons to jump onto the ions to start a reaction. A bigger hump usually means a degraded battery.
The Tail (Warburg Impedance, $Z_w$): The 45-degree line at the end. This represents how easily lithium ions can travel through the electrode bulk.
3. Why is it used?
Battery researchers and engineers use EIS for several critical reasons:
State of Health (SoH) Monitoring: As a battery ages, its internal resistance increases. EIS can identify exactly which part of the battery is failing (e.g., is the electrolyte drying up, or is the SEI layer too thick?).
Temperature Analysis: EIS shows how cold temperatures slow down ion movement, helping engineers design better thermal management systems.
Quality Control: In manufacturing, a quick EIS “fingerprint” can catch a defective battery cell before it leaves the factory.
Safety: EIS can sometimes detect internal short circuits or lithium plating before they lead to thermal runaway.
4. Equivalent Circuit Models (ECM)
To make sense of the squiggly lines in an EIS plot, engineers use Equivalent Circuit Models. They represent the battery as a combination of:
Resistors: For electrolyte and contact resistance.
Capacitors: For the “double-layer” of charge that builds up at the electrode surface.
Inductors: Usually representing the cables and setup used for the test.
2. Li-ion Transference Number (tLi+) (Bruce-Vincent Method)
This is measured using a Li/Electrolyte/Li symmetric cell, combining DC polarization and AC impedance.
The procedure consists of three stages:
Initial Impedance: Perform an EIS test to obtain the initial interfacial resistance, R0.
DC Polarization: Apply a small constant voltage (Delta V, typically 10 mV) and record the current until it reaches a steady state, Is. The initial current is I0.
Steady-state Impedance: Immediately perform another EIS test after polarization to obtain the steady-state interfacial resistance, Rs.
Key Parameters:
DC Voltage (Delta V): 10 mV (avoid high voltages to prevent dendrite growth).
Sampling Rate: Record current every 1s or 5s.
Steady-state Criterion: When current fluctuations become negligible.
3. Important Considerations
- Cell Stabilization: Before testing the transference number, Li/Li symmetric cells usually need to rest or undergo a few low-current cycles to form a stable SEI layer.
- Thickness Measurement: For solid electrolytes or soaked separators, even small errors in thickness (L) will directly affect the accuracy of the conductivity results.
- Environment: Testing must be conducted inside a glovebox or a well-sealed temperature-controlled chamber to avoid moisture and oxygen.
The following sharing comes from a friend of mine who does battery research. Source: WeChat Official Account “Brother Radish”. 萝卜大师兄 Lbdsx
1. Lithium-ion transference number
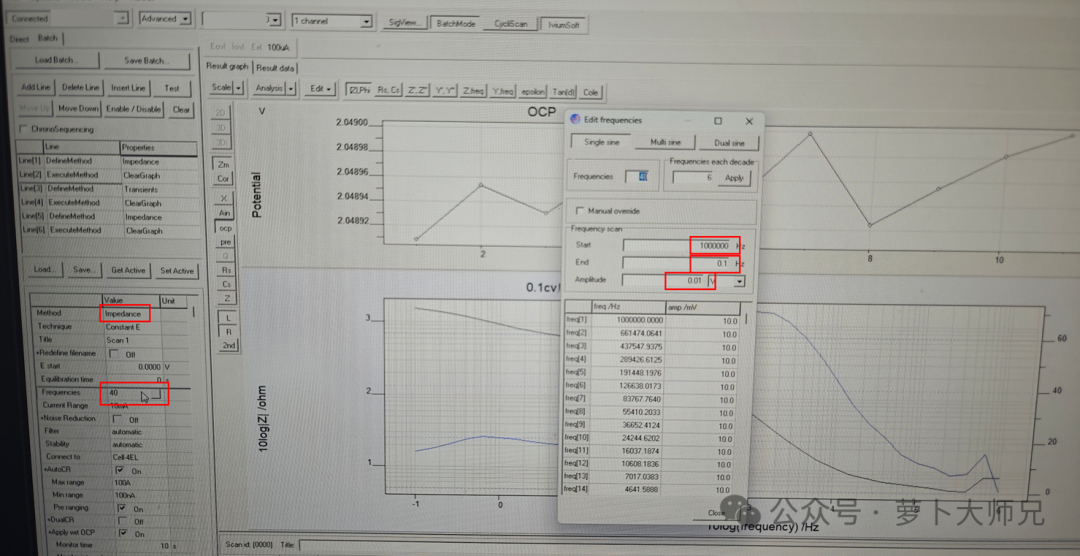
The lithium-ion transference number is measured by assembling a lithium-lithium symmetric battery. For solid-state polymer electrolytes, the battery should be left to stand in a 60°C oven for 12 hours before testing. For separator-modified batteries, standing at room temperature for about 6 hours is sufficient. First, an impedance test is performed at a frequency of 1 MHz to 0.1 MHz (or even 1 MHz, it doesn’t matter much), with an applied voltage of 10 mV (as shown in Figure 1).
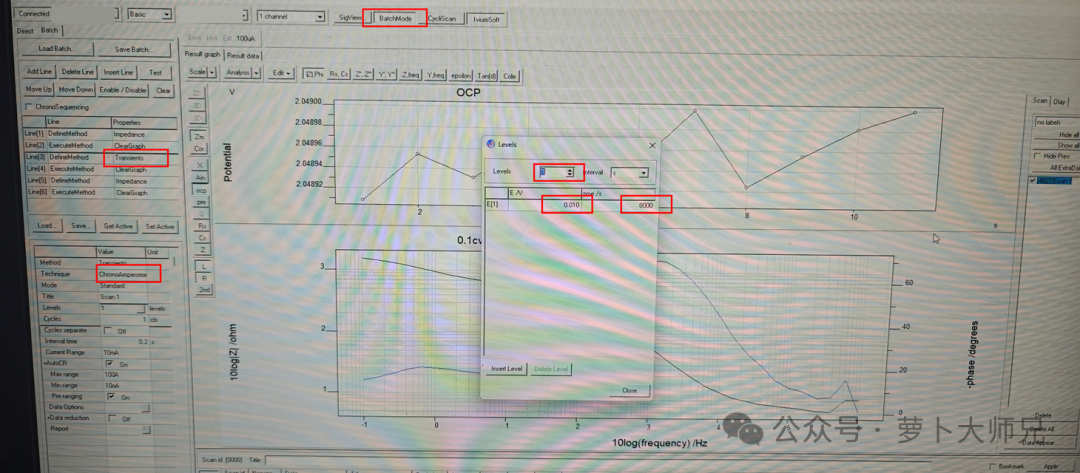
After the impedance test, immediately begin the chronoamperometry test (parameters shown in Figure 2). The chronoamperometry test uses one transition (we don’t need transitions to measure lithium-ion transference number). The polarization voltage is 10 mV (some tests use 20 mV, choose according to your needs; 10 mV is most common for solid-state batteries). The time is 8000 s (the time setting depends on when the curve starts to flatten; generally, for polymer electrolytes, it starts to flatten around 4000 s, so an extra 2000 s is sufficient; for ceramic electrolytes, it’s usually around 10000 s). The value is above s;
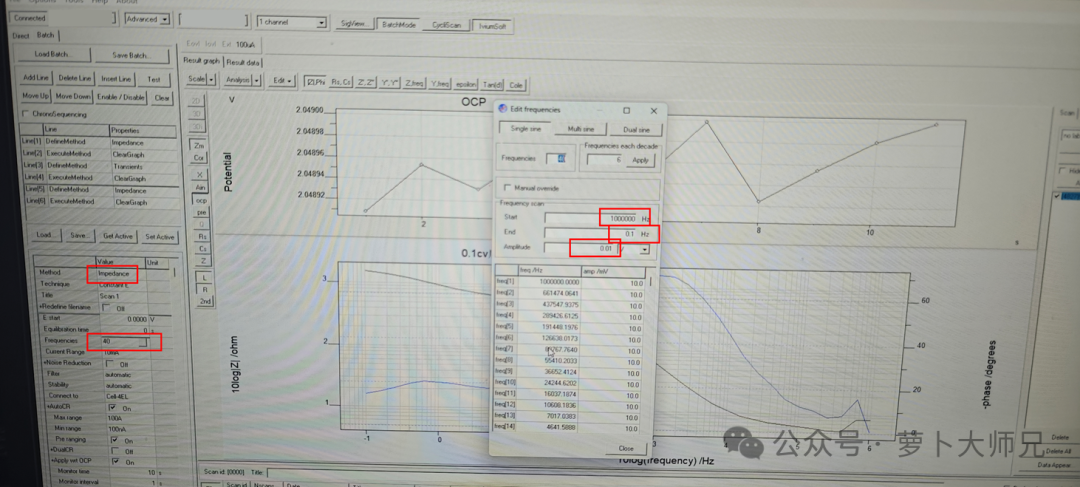
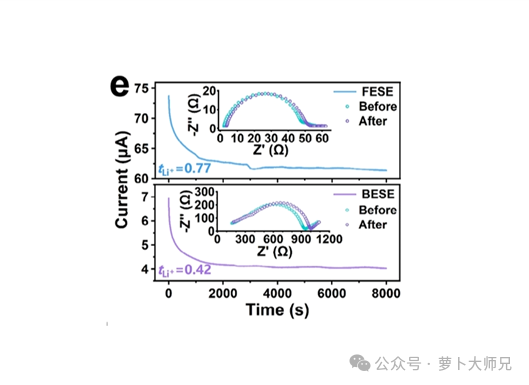
Immediately after the current-rate method test, proceed to the final impedance test. The parameters are the same as the first test. After this impedance test, the lithium-ion transference number test ends. We obtained two impedance data sets and one chronoamperometry (current-time curve (i-t)) data set. Plot the two impedance data sets on the same graph, read their impedances (R0 and Rs), plot the i-t curve, and read the first current value (i0) and the equilibrium current (is). Substitute these values into the formula to calculate the lithium-ion transference number. (Note: Since we are using an Ivium Technologies electrochemical workstation, steps 2, 4, and 6 are execution steps. This setting may not be required on other electrochemical workstations.)
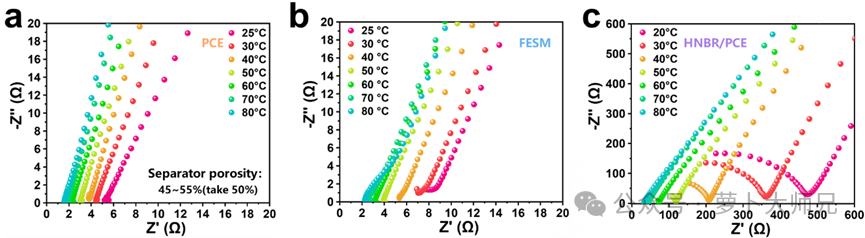
2. Ionic Conductivity Test
Ionic conductivity is measured by assembling a symmetrical steel sheet battery and then allowing it to stand for the same reasons as above. Only one impedance measurement is needed, using the same parameters. The result is a slanted impedance line. The intersection of its extension with the X-axis is taken as the impedance value (R). The formula also requires the membrane thickness, typically measured using a micrometer before battery assembly, and the area of the steel sheet. Substituting these values into the formula yields the ionic conductivity.
Due to the limited knowledge and English level is inevitable errors and omissions, if there are errors or infringement of the text, please contact me as soon as possible by private letter, I will immediately be corrected or deleted.