
Impact of Testing Fixtures on the Cycle Performance of LFP Batteries
Cycle performance is a fundamental metric for evaluating the service life of lithium-ion batteries. It is influenced by a wide range of factors, including material properties, cell structure, moisture content, and manufacturing processes. Furthermore, external parameters such as temperature, cycling protocols, and mechanical pressure also significantly impact the cycle performance of lithium-ion batteries.
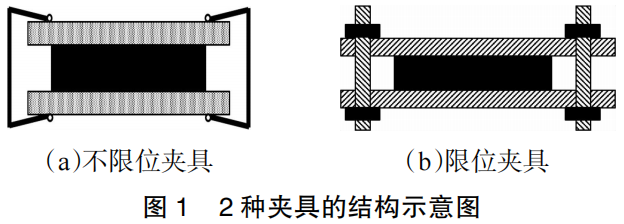
To investigate the effect of testing fixture constraints on cycle performance and to enhance the reliability of pouch cell testing during the system optimization phase, this study focuses on a 3.65 Ah LiFePO4 (LFP)/graphite pouch cell. Two types of testing fixtures were evaluated: non-constrained fixtures, utilizing wooden splints and binder clips, and constrained fixtures, utilizing aluminum plates and bolts. The study examines the comparative impact of these two fixture configurations on the cycle performance of the LFP batteries.
1 Materials and Methods
1.1 Experimental Samples
The test subjects of this study are finished LiFePO4/graphite pouch lithium-ion batteries manufactured by Tianjin Lishen Battery Joint-Stock Co., Ltd. Two groups of batteries were subjected to cycle testing at 45°C using different fixtures: unconstrained fixtures (consisting of wooden splints and binder clips) and constrained fixtures (consisting of aluminum plates and bolts with a preload of 0.2 MPa). Both the charging and discharging currents were set to 1C (1C = 3,650 mA), within a voltage range of 2.50–3.65 V. The testing followed a 100% depth of discharge (DOD) protocol. Direct current internal resistance (DCIR) tests were performed every 100 cycles, and the testing was concluded once the cycle count reached 1,800.
1.2 Performance Testing and Methodology
Electrochemical impedance spectroscopy (EIS) of the full cells after cycling was conducted using a Gamry Electrochemical Workstation (USA). EIS curves were measured at three different states of charge (SOC): 0%, 50%, and 100%. The tests were performed in potentiostatic (voltage) mode with an amplitude of 2 mV across a frequency range of 0.1 to 20,000 Hz.
Material structural analysis was performed using a Rigaku (Japan) X-ray diffractometer (XRD) to obtain the XRD patterns of the anodes at 100% SOC. Thermal decomposition of the solid electrolyte interface (SEI) film was analyzed using differential scanning calorimetry (DSC) on anode powders at 100% SOC within a temperature range of 25 to 200°C. Surface morphology analysis was carried out using a JEOL (Japan) 7600F scanning electron microscope (SEM). Elemental composition analysis was conducted via inductively coupled plasma atomic emission spectroscopy (ICP-AES). Finally, the air permeability of the separators was measured using a GURLEY 4150N tester.
2 Results and Discussion
2.1 Analysis of Battery Electrochemical Characteristics
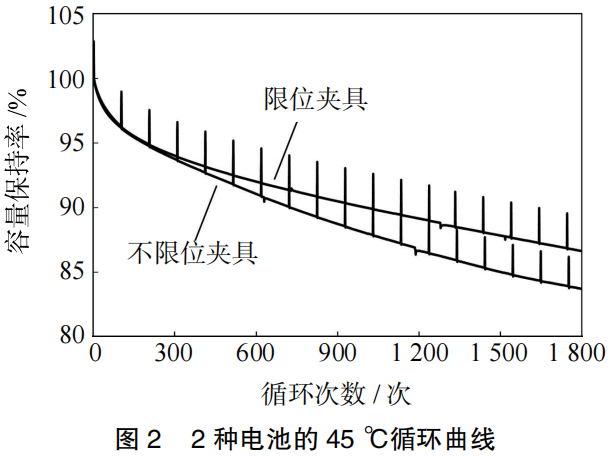
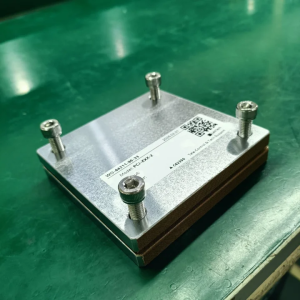
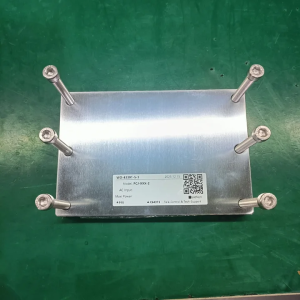
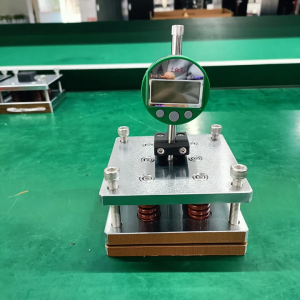
The structural schematic diagrams for the unconstrained and constrained fixtures are shown in Figure 1. The 45°C cycling performance curves of the batteries tested using these two types of fixtures are illustrated in Figure 2.
After 1,800 cycles, the battery tested with the unconstrained fixture exhibited a capacity retention rate of 83.7% and a swelling rate of 7.0%. In contrast, the battery tested with the constrained fixture showed a capacity retention rate of 86.6% and a swelling rate of only 1.5%.
The cycle performance of the batteries using the constrained fixture is significantly superior to those using the unconstrained fixture, with the capacity retention rate improving by 2.9% and the swelling rate decreasing by 5.5%.
To analyze the root cause of the impact of the test fixture on the battery cycle performance, we first compared the DC internal resistance (DCIR) of the battery during the 45℃ cycle under two cycling methods and the AC impedance (EIS) at 25℃, 0% SOC, 50% SOC, and 100% SOC after 1800 cycles. The curves are shown in Figure 3. Use Neware battery cyclers test battery cycle performance.
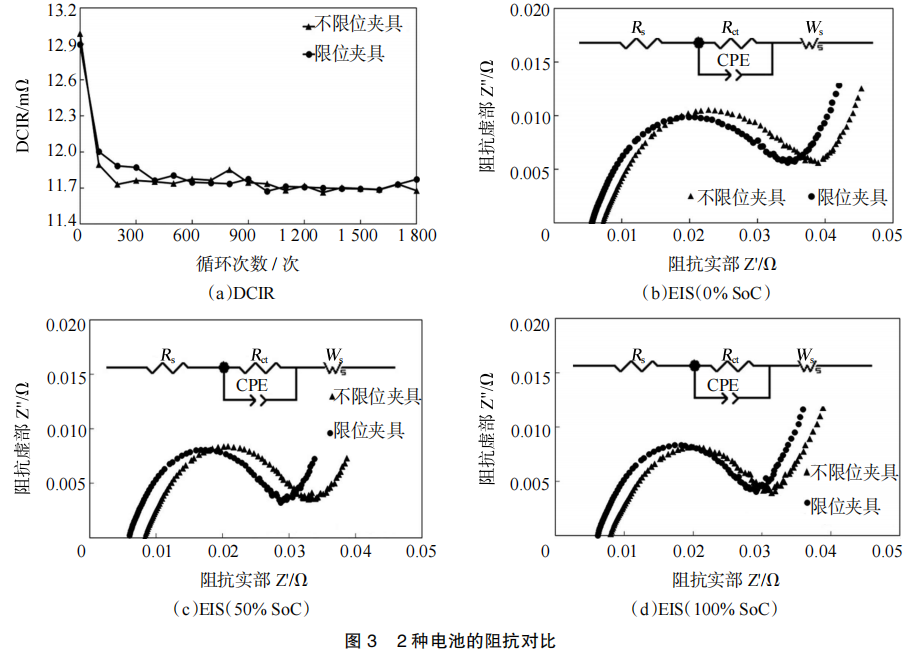
As shown in Figure 3(a), there is no significant difference in the DC internal resistance (DCIR) of the batteries at 45°C under the two cycling modes, indicating that the testing fixtures have little impact on the DCIR at high temperatures. Figures 3(b)–(d) illustrate the EIS curves tested at 25°C after 1,800 cycles for the batteries at 0%, 50%, and 100% SOC, respectively. The curves consist of two parts: the first part is a semicircle, where the intercept with the horizontal axis represents the ohmic resistance (Rs), and the radius of the semicircle correlates with the charge transfer resistance (Rct); the second part is a diagonal line, the slope of which is related to the diffusion impedance (Ws).
The AC impedance fitting data are presented in Table 1. It can be observed that the primary difference in impedance between the two cycling modes lies in Rs. The Rs of the batteries tested with the constrained fixture is significantly lower than that of the unconstrained fixture. This suggests that the constrained fixture effectively reduces the electrode gap, improves the battery interface, and enhances interfacial consistency. Consequently, this slows the consumption of active lithium ions, reduces electrolyte depletion and internal side reactions, and ultimately delays capacity decay while lowering the ohmic internal resistance.
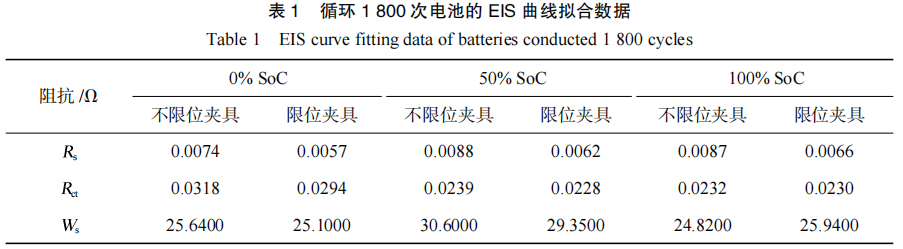
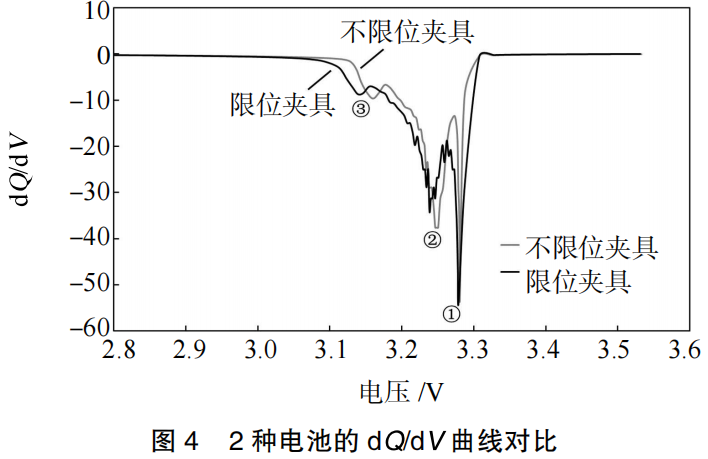
Figure 4 shows the differential capacity (dQ/dV) curves of the batteries after cycling. It can be observed that the dQ/dV curves exhibit three distinct peaks, each corresponding to the three phase transition processes of the graphite electrode. There is a significant difference in the total area of these three peaks. Specifically, Peak 1 corresponds to the formation of the lithium-graphite intercalation compound, LiC6. The reduction in the area of Peak 1 for the battery in the unconstrained fixture indicates a greater loss of active lithium. Utilizing a constrained fixture during testing increases the area of Peak 1 in the dQ/dV curve, demonstrating that the constrained fixture reduces interfacial side reactions, thereby mitigating the loss of active lithium.
2.2 Electrode Plate Analysis
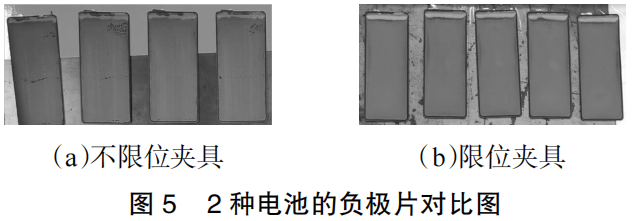
The two groups of batteries were charged at a constant current of 0.33C to 3.65V, followed by constant voltage charging until a cutoff current of 0.05C was reached. The batteries were then disassembled for inspection. The surface conditions of the resulting anodes are shown in Figure 5.
It can be observed that there is significant lithium plating at the top of all anode plates. This is primarily attributed to insufficient coating precision at this location, leading to a capacity mismatch between the cathode and anode over the same area. Furthermore, the surface of the anode from the battery tested with the unconstrained fixture shows clear signs of failure, specifically exhibiting a “dead zone” failure mode. In contrast, the anode from the battery tested with the constrained fixture remains in better condition with no significant signs of failure.
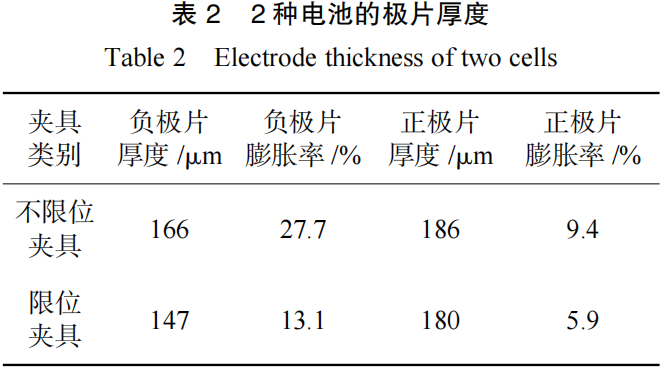
To analyze the cause of this discrepancy, the thicknesses of both the cathode and anode plates were measured, with the results summarized in Table 2. It was found that the thickness and swelling rate of the electrodes tested with the constrained fixture were significantly lower than those tested with the unconstrained fixture; this is the primary factor driving the difference in overall cell swelling. The disparity in electrode thickness likely stems from a higher accumulation of side reaction products on the electrode surfaces in the unconstrained test group. To verify this hypothesis, a series of in-depth analyses and tests were conducted.
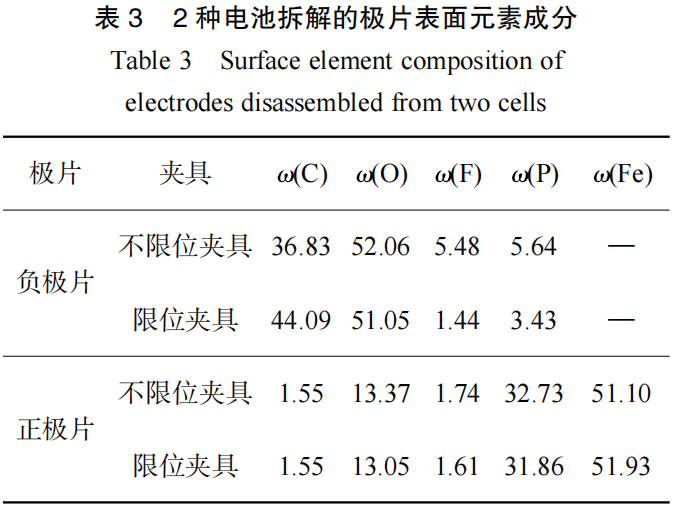
First, the microstructure and surface composition of the positive and negative electrodes were analyzed using scanning electron microscopy (SEM) and energy dispersive spectroscopy (EDS). The test results are shown in Figure 6 and Table 3, respectively.
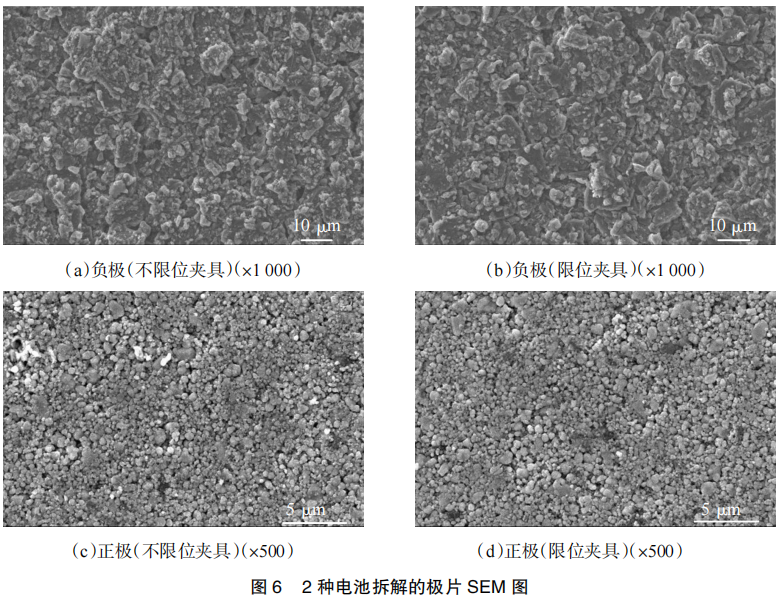
SEM image comparison revealed a large amount of by-reaction products on the negative electrode surface of both types of clamps, but the clamped clamp showed fewer by-reaction products and a more pronounced particulate appearance. EDS comparison showed higher levels of oxygen, fluorine, and phosphorus on the negative electrode surface of the battery tested with the un-clamped clamp, indicating more by-reactions, consistent with EIS test results. The surface morphology and composition of the positive electrode showed little difference, indicating that the use of the un-clamped and clamped clamps had minimal impact on the morphology of the positive electrode.
The X-ray diffraction (XRD) patterns and differential scanning calorimetry (DSC) curves of the fully charged anodes from the two battery groups are shown in Figure 7. As seen in the XRD patterns, the primary difference between the two cycling modes lies in the (002) peak between 20°~30°. During the lithiation process, graphite first transforms into the transitional phase LiC12 and subsequently into the final phase LiC6. Consequently, at a high SOC, the graphite (002) peak splits into two: the left peak represents LiC6, while the right peak represents LiC12.The anode from the battery tested with the unconstrained fixture exhibits a stronger LiC12 peak intensity, indicating a lower degree of lithiation in the graphite and a greater loss of active lithium. This loss of active lithium is primarily due to internal side reactions during cycling, where the continuous repair of the SEI film consumes a significant amount of active lithium. These results further demonstrate that the use of a constrained fixture can effectively mitigate the occurrence of internal side reactions within the battery.
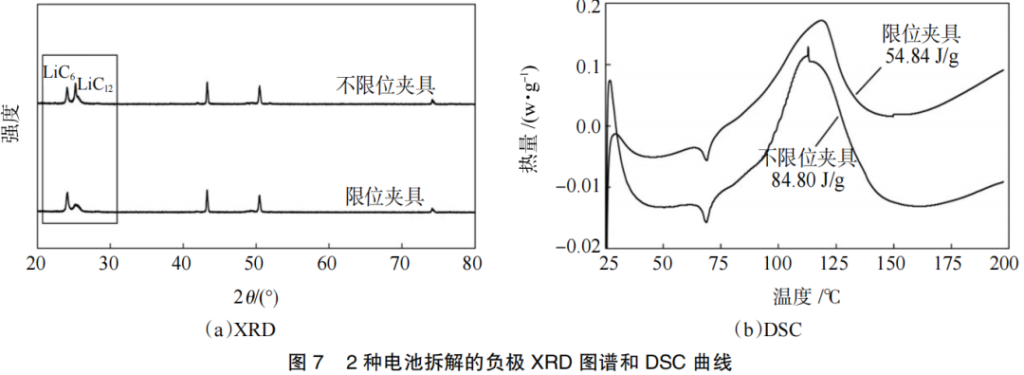
The DSC curves reveal that the SEI film undergoes decomposition within the temperature range of 80–150°C. The decomposition enthalpy (ΔH) of the SEI film for the battery tested with the unconstrained fixture was 84.8 J/g, whereas that of the constrained fixture was 54.8 J/g. The significantly higher heat release in the unconstrained group indicates that continuous repair of the SEI film led to the formation of a much thicker layer. In contrast, the battery tested with the constrained fixture maintained a superior interface, avoiding repetitive SEI repair and resulting in lower heat release. This confirms that the use of a constrained fixture effectively reduces SEI damage and the occurrence of side reactions.
Inductively coupled plasma (ICP) spectroscopy was employed to measure the concentrations of Fe and Li elements in the anode plates at 100% SOC. The results showed that for the unconstrained fixture, the mass fractions of Fe and Li were 20.7×10⁻⁶ and 37335.5×10-6, respectively; for the constrained fixture, these values were 21.0×10⁻⁶ and 40840.8×10-6.
It can be observed that there is essentially no difference in the Fe content between the two anode groups. Since Fe in the anode primarily originates from iron dissolution from the cathode, this suggests that neither fixture caused damage to the cathode structure. However, a significant disparity exists in the Li content. The Li concentration in the anode from the constrained fixture is markedly higher than that from the unconstrained fixture, which is consistent with the XRD results. During cycling, the expansion of the cathode and anode plates triggers an increase in side reactions, which in turn elevates the expansion force. The wooden splints, however, deform under this pressure, leading to non-uniform stress distribution across the cell. This further accelerates side reactions between the electrode interfaces and the electrolyte, consuming a large amount of active lithium and resulting in degraded cycle life.
2.3 Separator Analysis
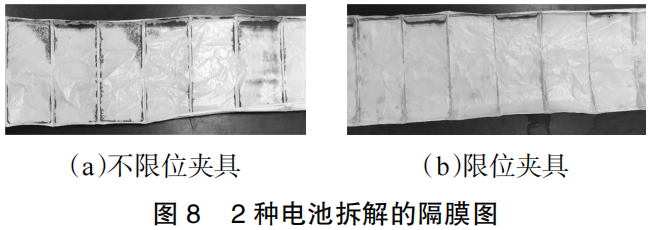
The surface conditions of the separators from the batteries after cycling are shown in Figure 8. It is clearly evident that the separator from the battery tested with the unconstrained fixture is covered with a significant amount of side reaction products across its main surface, with the locations of these deposits matching the failure zones observed on the anode. In contrast, the separator from the battery tested with the constrained fixture appears relatively clean, with far fewer adhered side reaction products. This demonstrates that the constrained fixture effectively reduces interfacial side reactions between the anode and the electrolyte, thereby mitigating the consumption of active lithium.
To further analyze the impact of the testing fixtures on the micro-morphology of the separators, SEM imaging was performed, with the results shown in Figure 9. It can be observed that there is no significant difference in the ceramic-coated side of the separators between the two groups. This is primarily because the ceramic side is in contact with the cathode, which showed no obvious signs of failure; thus, the ceramic surface remained in good condition.
However, differences were observed on the base film (polymeric) side of the two separators, which is in contact with the anode. For the battery tested with the unconstrained fixture, the occurrence of interfacial side reactions at the anode led to elevated local temperatures. This resulted in extensive pore-clogging in the separator, which obstructs lithium-ion transport and increases cell polarization, thereby accelerating cycle degradation.
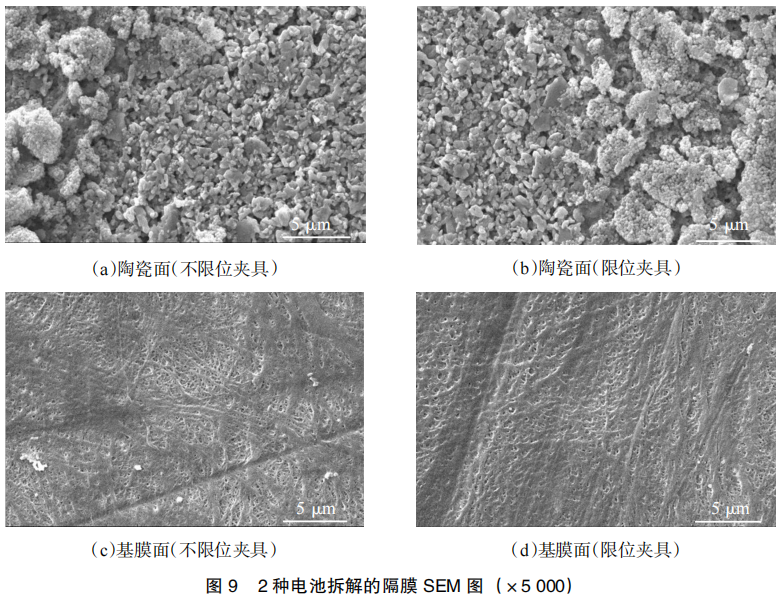
To confirm that the separator from the battery tested with the unconstrained fixture experienced more pore-clogging, an air permeability test was conducted. The resulting air permeation times for the unconstrained and constrained fixtures were 7.1 s and 6.8 s, respectively. It can be seen that the air permeation time for the constrained fixture group is significantly lower, indicating better permeability and fewer blocked pores. Consequently, the surface condition, pore-clogging status, and permeability data all demonstrate that the unconstrained fixture has a greater adverse effect on the separator, the root cause of which remains the higher incidence of side reactions.
3 Impact of Testing Fixtures on the Cycle Performance of LFP Batteries
1) Whether a fixture provides mechanical constraint has little impact on the micro-morphology or surface composition of the cathode. However, the constrained fixture reduced the mass fractions of side reaction products (oxygen, fluorine, and phosphorus) on the anode surface by 1.0%, 4.0%, and 2.2%, respectively. It also increased the $LiC_6$ peak intensity, reduced the loss of active lithium ions, and lowered the SEI film decomposition heat by 35%, thereby mitigating SEI decomposition and repetitive repair.
2) The constrained fixture reduces interfacial side reactions between the anode and the separator, decreasing the pore-clogging rate and improving separator permeability by 4.2%, which facilitates lithium-ion transport.
3) The constrained fixture enhances the uniformity of stress distribution, improves the interfacial contact between the cathode and anode plates, reduces the ohmic internal resistance by more than 20%, and improves the cycle performance of the battery by 2.9%.
4) By comparing the effects of constrained versus unconstrained fixtures, this study reveals that during the system optimization phase of power battery development, metal plate constrained fixtures must be used when testing pouch cells to ensure reliability. Furthermore, these results provide valuable insights for module structural designers, highlighting the need to ensure uniform pressure on individual cells within a module to extend the overall service life.
Reference: Wang Hao, Zeng Tao, Liu Bozheng, Zhao Lipeng. Influence of test fixtures on the cycle performance of lithium iron phosphate batteries [J]. Energy Research and Management, 2022(3):56-62
Contact Neware
Due to the limited knowledge and English level is inevitable errors and omissions, if there are errors or infringement of the text, please contact me as soon as possible by private letter, I will immediately be corrected or deleted.