
Real-time visualization of SEI formation: Reducing battery formation time from 20 hours to 1 hour
Source: WeChat Official Account “Lithium Dream Life”
In the lithium-ion battery manufacturing process, there is a critical yet long-standing “invisible” step—Battery Formation. This stage directly determines a battery’s cycle life, safety, and consistency. However, it typically requires 10 to 20 hours or even longer to complete, representing a major source of manufacturing costs and safety risks.
Recently, a collaborative research team from the University of Texas at Austin, Purdue University, and General Motors (GM) achieved a breakthrough by directly observing the formation of the Solid Electrolyte Interphase (SEI) under real battery operating conditions for the first time. Based on these observations, they proposed a novel high-current pulse formation strategy. This approach slashes formation time to approximately 1 hour while maintaining stable battery performance. This study not only refreshes our understanding of SEI formation mechanisms but also offers a transformative process for large-scale lithium-ion battery manufacturing.
A Long-Standing Mystery: How Does SEI Actually Form?
The SEI is a nanometer-scale interface film formed on the surface of the graphite anode during the initial charge. Despite being only a few to dozens of nanometers thick, it plays a vital role: controlling further electrolyte decomposition, influencing lithium-ion transport efficiency, and directly determining battery lifespan and safety. For decades, researchers have relied on “post-mortem” analysis techniques like Electron Microscopy and XPS. However, these methods only provide static information and fail to capture the dynamic formation process. In other words, while the importance of SEI is well-known, we have never been able to truly “see” it being generated step-by-step.
“Visualizing” the Interface via Optical Microscopy
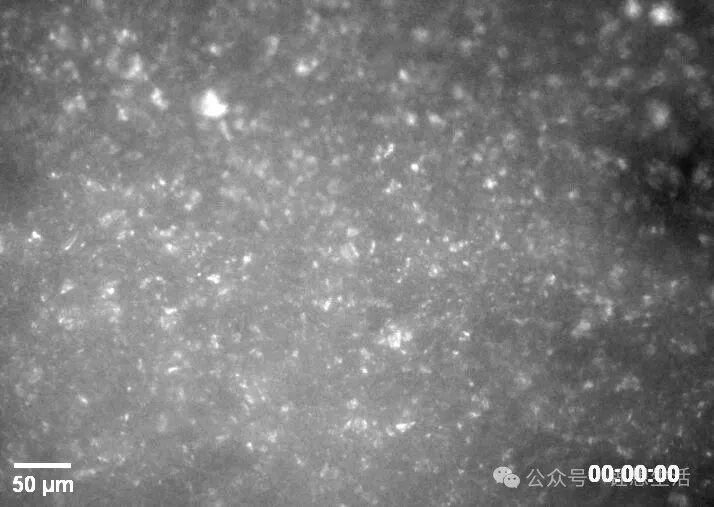
The research team utilized an ingenious physical principle: the generation of SEI changes the refractive index matching on the electrode surface, leading to a decrease in reflected light intensity. Based on this phenomenon, they designed a battery structure with a transparent window to continuously record changes on the graphite surface using operando optical microscopy under real electrochemical conditions. The imaging results revealed that under low-current conditions, SEI does not form uniformly; instead, it initiates sequentially across different regions through a “localized nucleation and progressive expansion” mechanism.
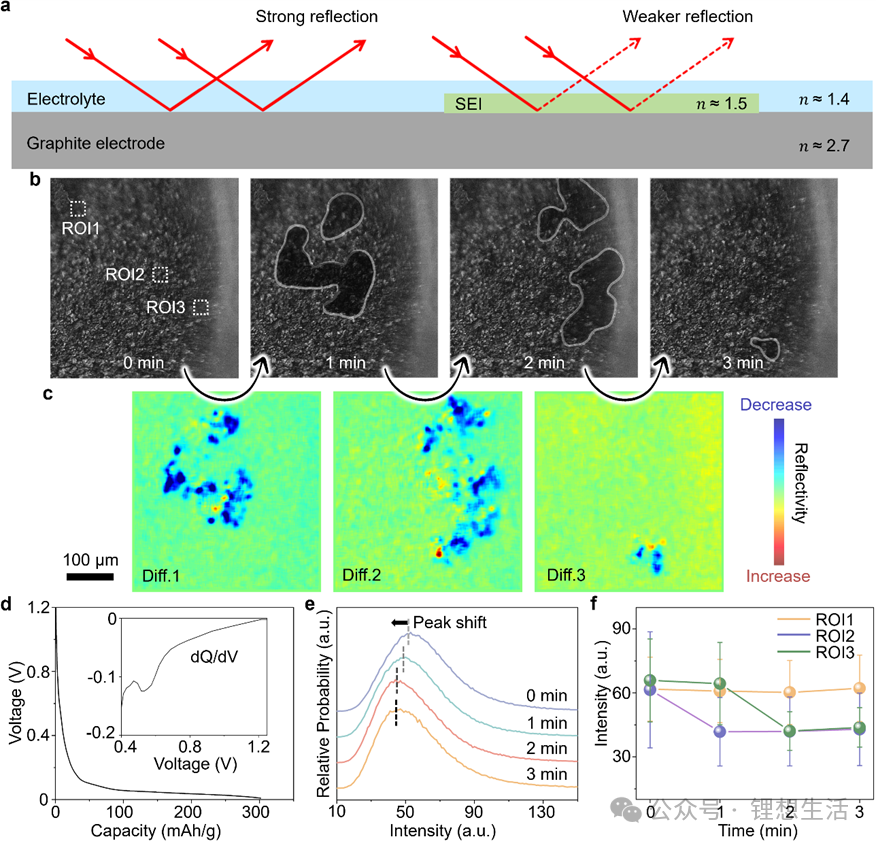
Figure Captions
a) Schematic illustration of the refractive index matching effect.
b) Optical microscopy images of the graphite electrode surface obtained during the initial lithiation process.
c) Continuous differential images showcasing the active regions on the graphite electrode surface within corresponding time windows.
d) Electrochemical data for the initial lithiation of a graphite/Li metal half-cell at a C/10 rate. The inset shows the differential capacity (dQ/dV, in mAh/V) versus voltage curve.
e) Histograms depicting the evolution of graphite surface image intensity over time.
f) Intensity-versus-time curves for the three regions of interest (ROIs) labeled in Figure b.
If you want to do capacity, cycle life, pulse, DCIR, GITT, HPPC, or EV driving simulation test, please feel free to contact us. Neware battery testing system
Upturning Conventional Wisdom: High Current Actually Leads to Superior Uniformity
Traditional formation processes typically employ low current, based on the rationale that it is “gentler and facilitates the formation of a uniform SEI.” However, the research findings present the opposite trend. When the charging current is increased, more regions overcome the reaction energy barrier almost simultaneously, with the SEI exhibiting a synchronized generation characteristic. Coupled with multiphysics finite element simulations, the team discovered that the SEI formed under high-current conditions is thinner and has a more uniform thickness distribution. This discovery challenges decades of mainstream consensus regarding the battery formation process.
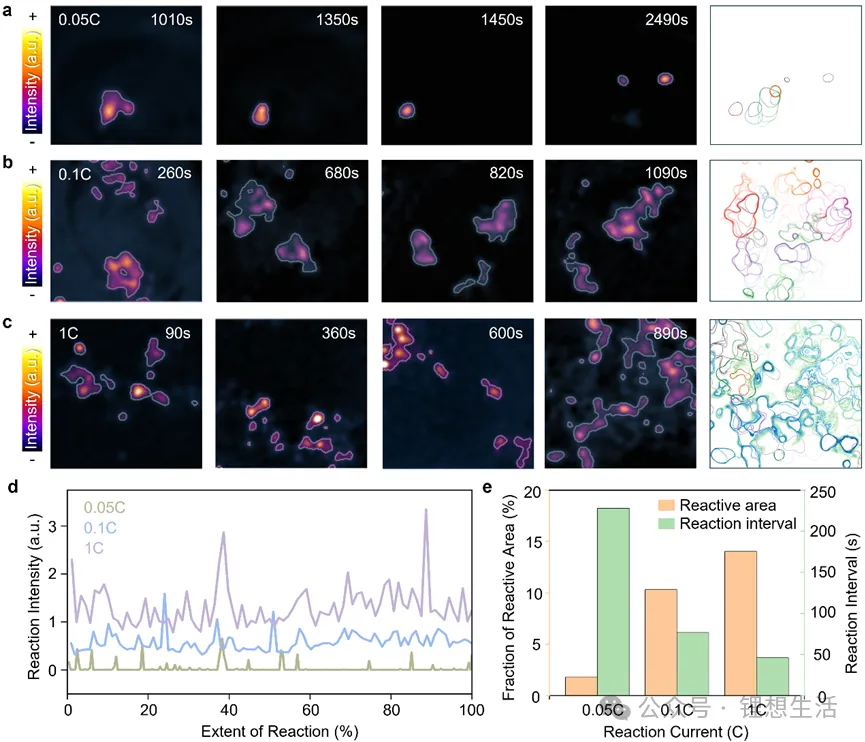
a. Continuous difference plot and SEI coverage evolution of graphite/Li metal half-cell at C/20.
b. Continuous difference plot and SEI coverage evolution of graphite/Li metal half-cell at C/10.
c. Continuous difference plot and SEI coverage evolution of LiFePO₄(LFP)/graphite full cell under a 1C pulsed current structure.
d. Changes in reaction intensity over time during the first charge under different current conditions.
e. Average reaction area and time interval between successive SEI formation events.
Test your half cells and full cells
From Laboratory Discovery to Industrial Application
Based on this understanding of the mechanism, the team further designed a high-current pulse formation strategy (such as 1C charging combined with short rest or discharge intervals) and verified it in LFP/graphite button cells and 2 Ah pouch cells. Results showed that the formation time was reduced from 10–20 hours to approximately 1 hour; the capacity retention rate remained above 90% after 1000 cycles; the interface impedance was lower, and the polarization problem was effectively alleviated.
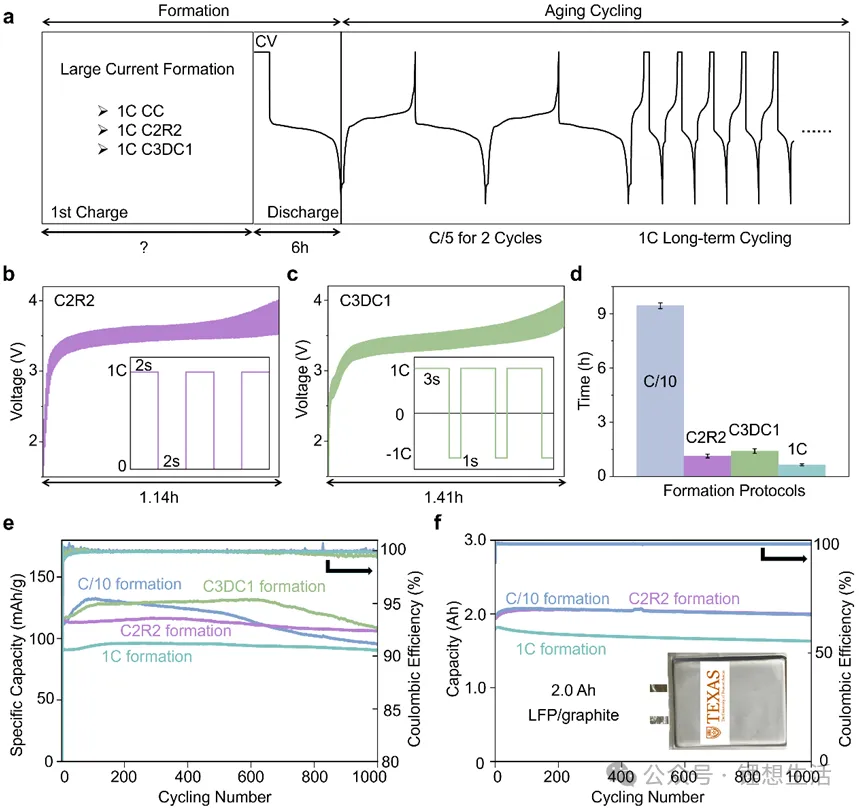
Figure 3: Design and performance analysis of high-current formation strategy. a, Schematic diagram of formation and aging cycle test process. b, First-cycle charging voltage curve and pulse current structure of C2R2. c, First-cycle charging voltage curve and pulse current structure of C3DC1. d, Formation time (i.e., first lithium insertion time) of LFP/graphite coin cells under different formation strategies. e, Electrochemical performance of LFP/graphite coin cells under different formation strategies. f, Electrochemical performance of 2 Ah LFP/graphite pouch cells under different formation strategies.
The formation stage accounts for approximately one-third of the cost of lithium-ion battery manufacturing. A large number of cells can be produced every minute on the production line, but these cells must remain stationary for tens of hours during the formation stage. Longer time means: larger factory space; higher energy consumption; and higher safety risks. Reducing the formation time by an order of magnitude would significantly improve production line turnover efficiency and reduce safety hazards. From interface science to manufacturing engineering, this research connects fundamental mechanisms with industrial practice.
For a long time, SEI formation has been a black box process that is difficult to observe directly. This time, the research team revealed the dynamic generation mechanism of SEI through real-time optical visualization and proposed a new formation strategy based on this. In the context of increasingly fierce competition in the lithium-ion battery industry and continuous improvement in manufacturing efficiency, this research, which transforms fundamental scientific discoveries into process optimization solutions, may have a more profound impact on next-generation battery manufacturing.
Full text: