Neware Battery Testing System

NEWS

Home > News

How to add the export report option to the right-click menu?

Neware BTS 8.0: How to add the export report option to the right-click menu?

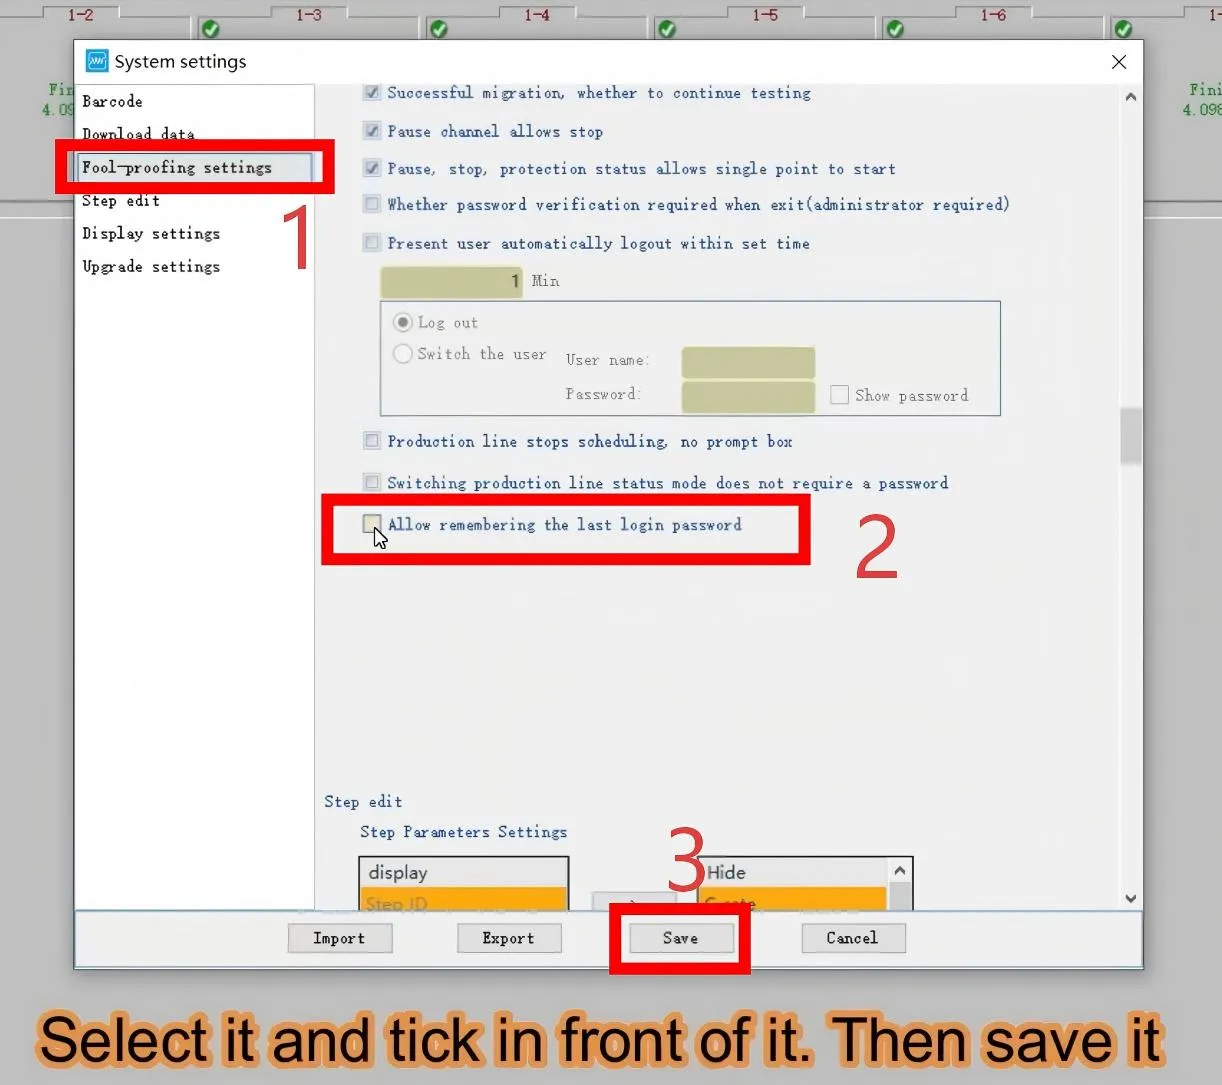
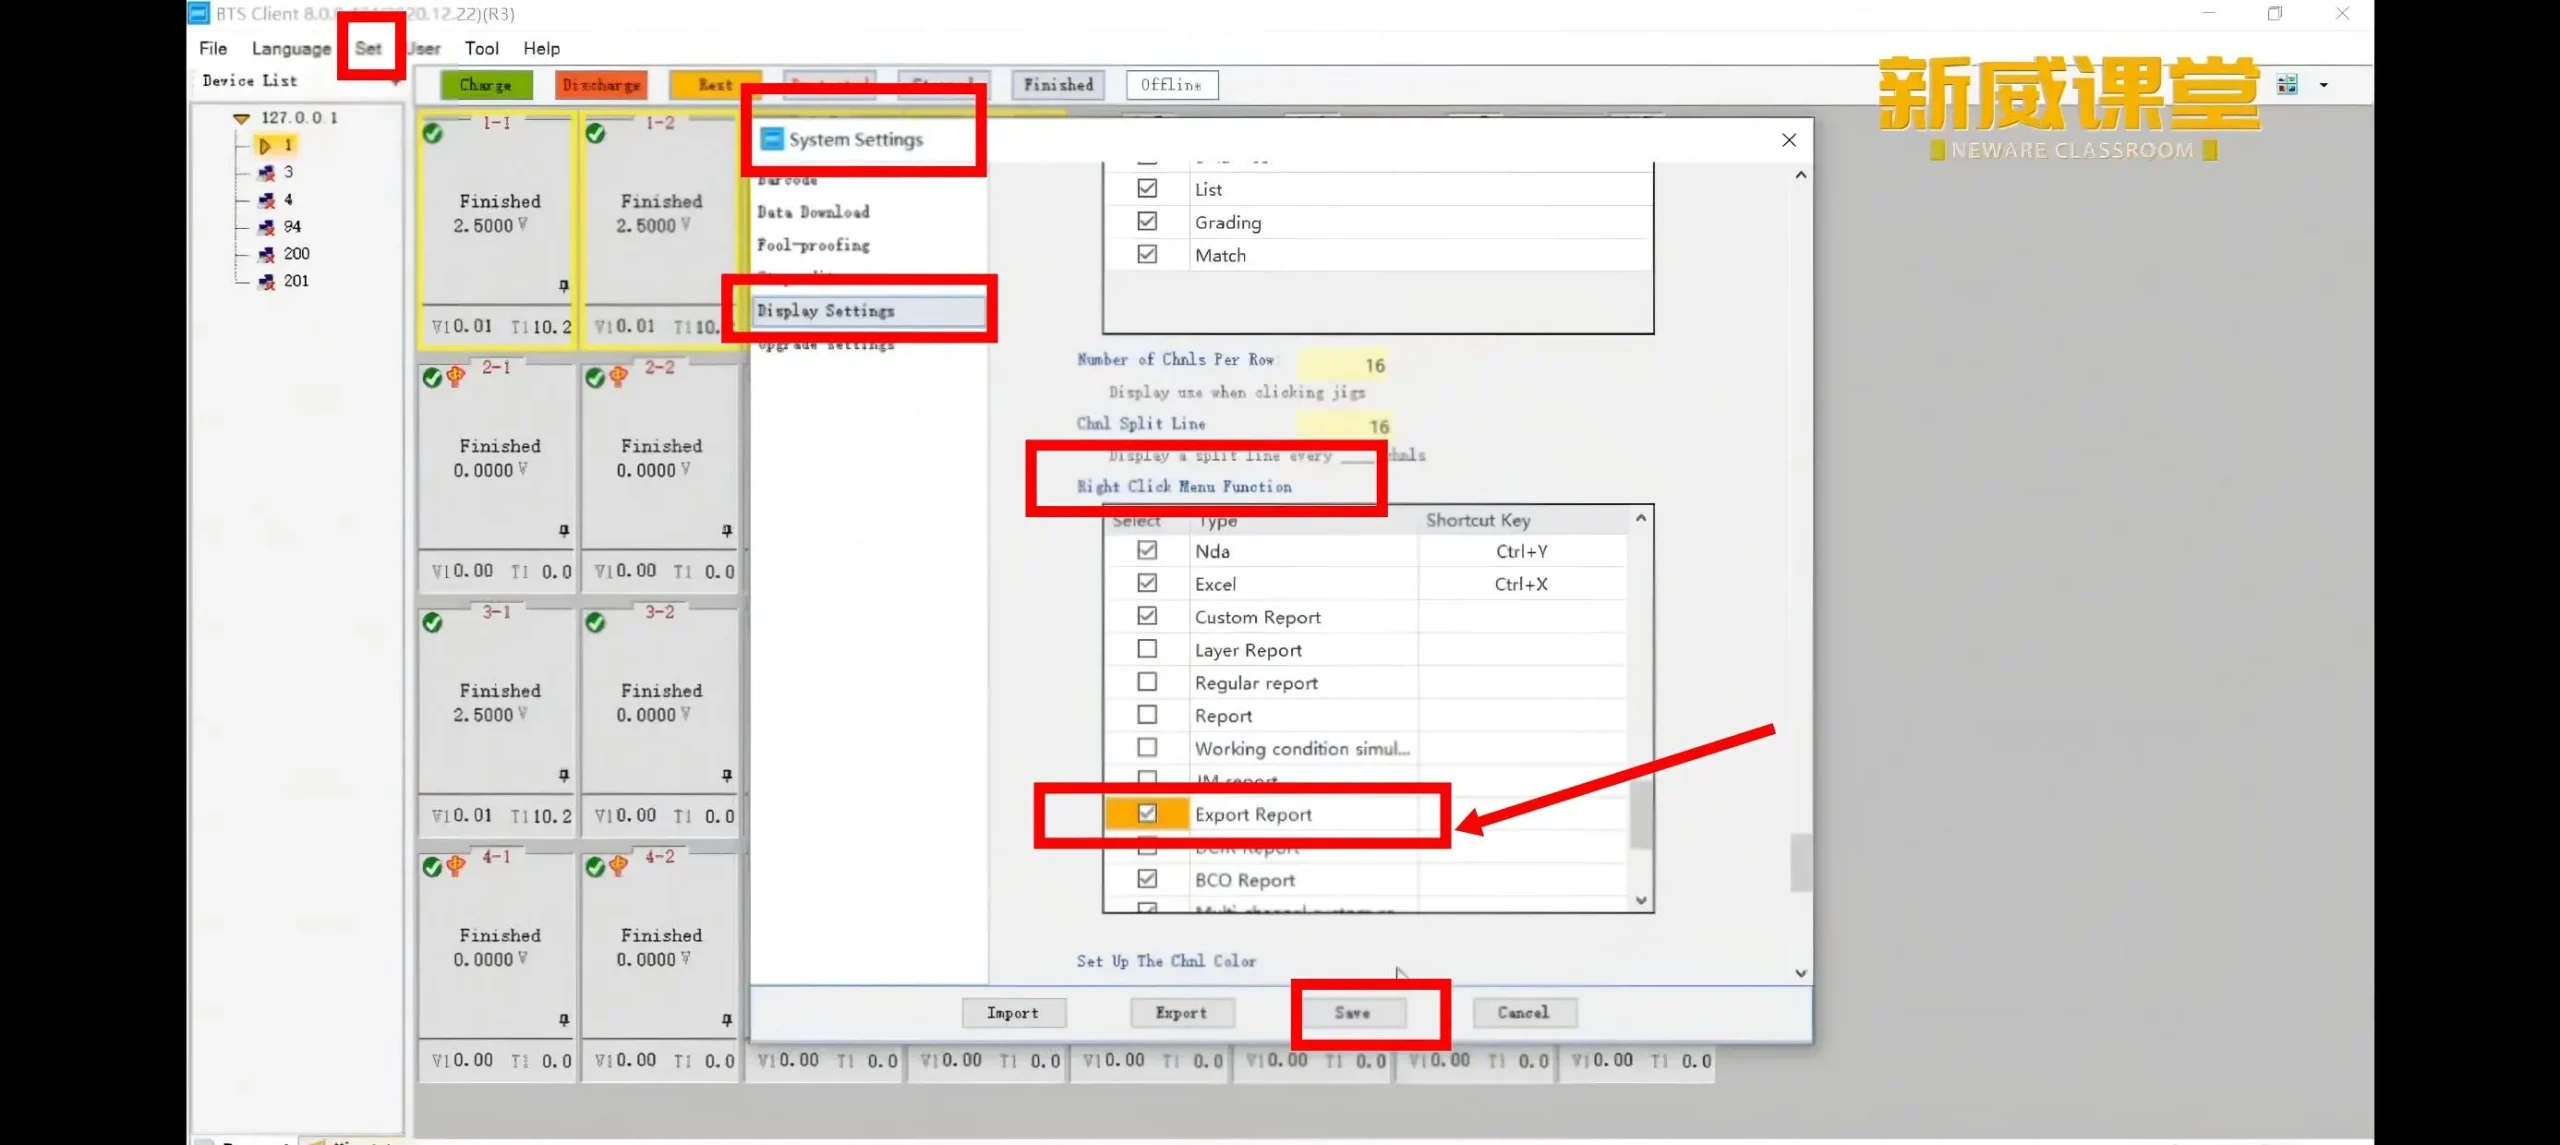
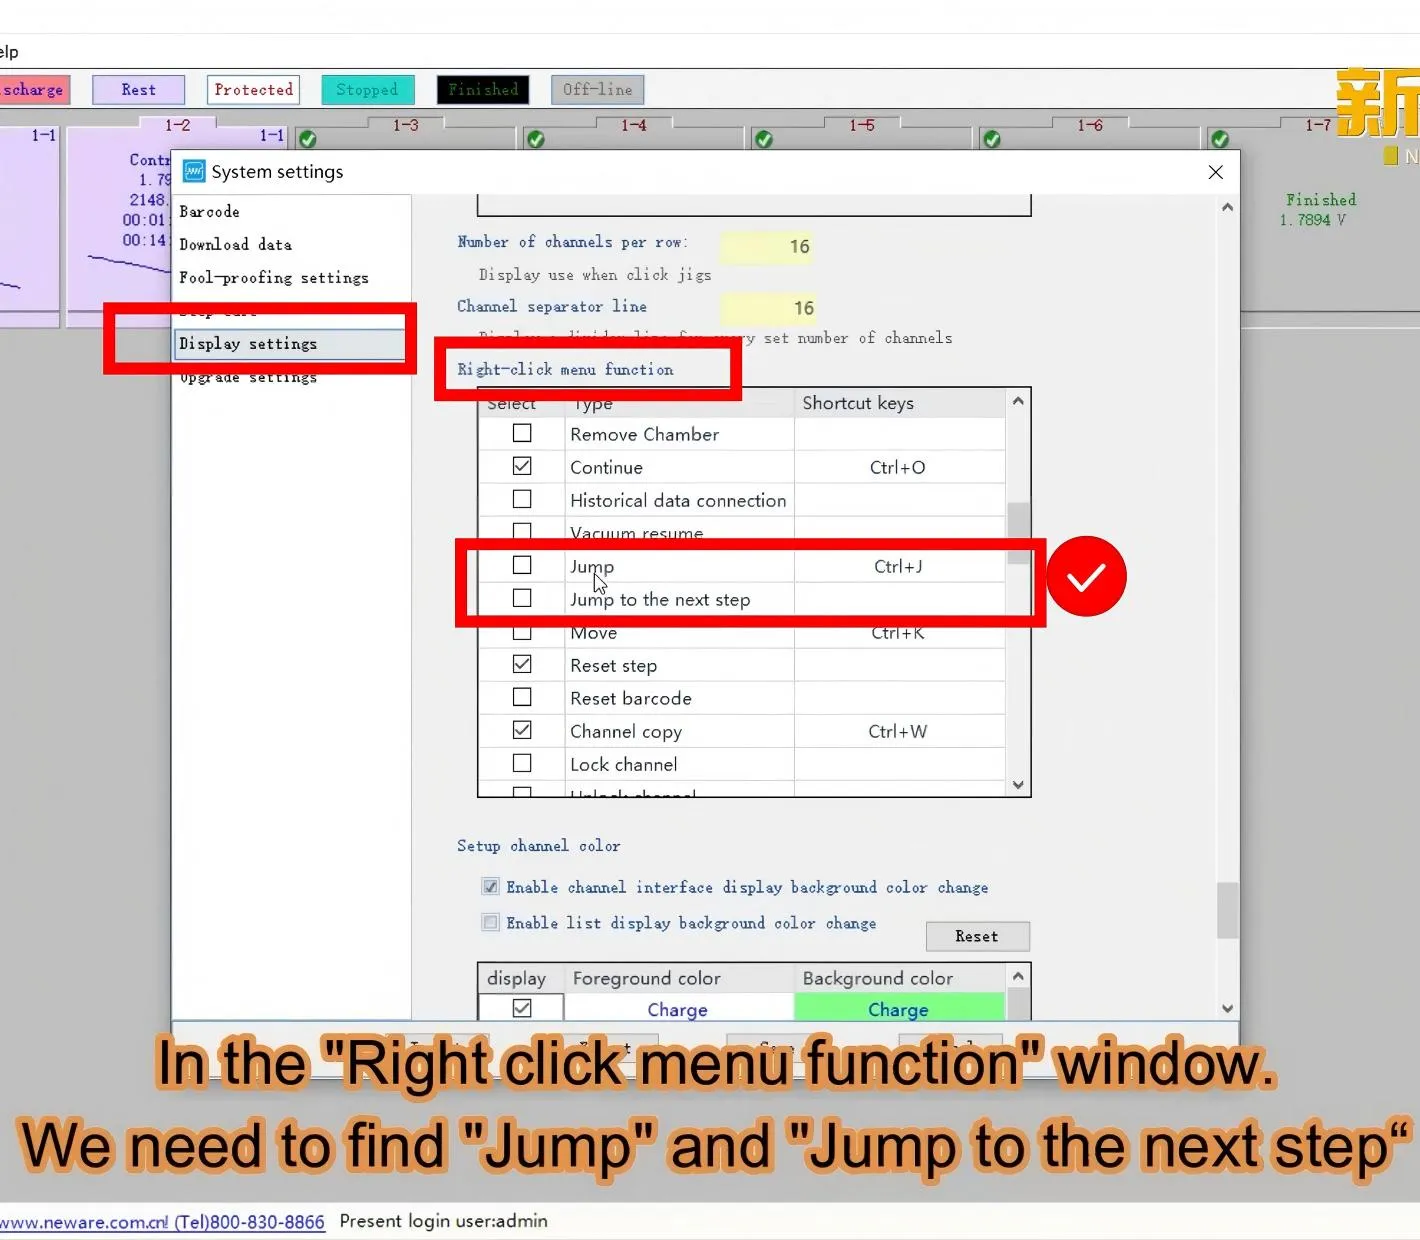
Neware BTS 8.0: How to add the export report option to the right-click menu? Click Set on the top menu bar, then select System Settings. Go to Display Settings, locate the Right-click menu function section, check the box for Export report or Multi-channel customize report. Click Save, then log out and log back into the software to activate the setting. User name:  admin Password: neware Right-click the test channel, and you will see the report export function in the pop-up menu. You can follow the steps in this video for operation.

Neware BTS 8.0

How to control third-party chambers with Neware BTS 8.0?

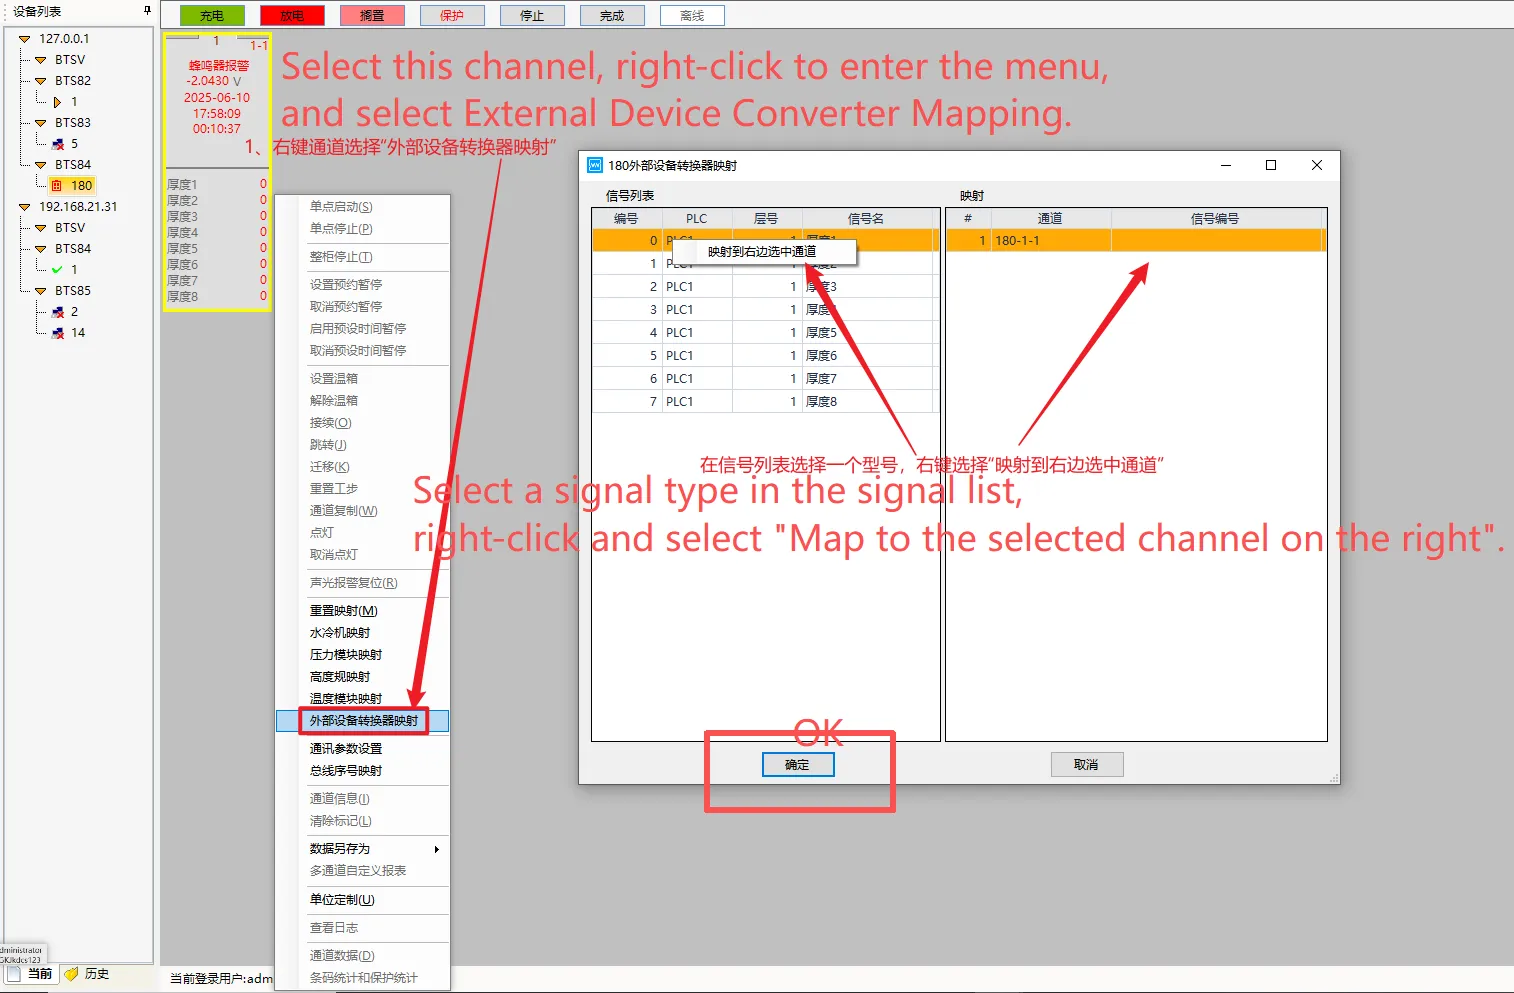
Can I use Neware BTS 8.0 control third-party chambers? If you have purchased Neware testing equipment and wish to use it with environmental chambers from other brands, how can you use Neware BTS 8.0 software to control those third-party chambers? First of all, please submit this request to your sales representative. We will need the following information regarding your environmental chamber: its communication method and communication protocol. Our engineers need this information to evaluate whether this requires a custom software feature developed specifically for you, or if our existing software already supports it. For example, Neware temperature chamber can be controlled on Neware BTS 8.0 via TCP/IP communication. How to

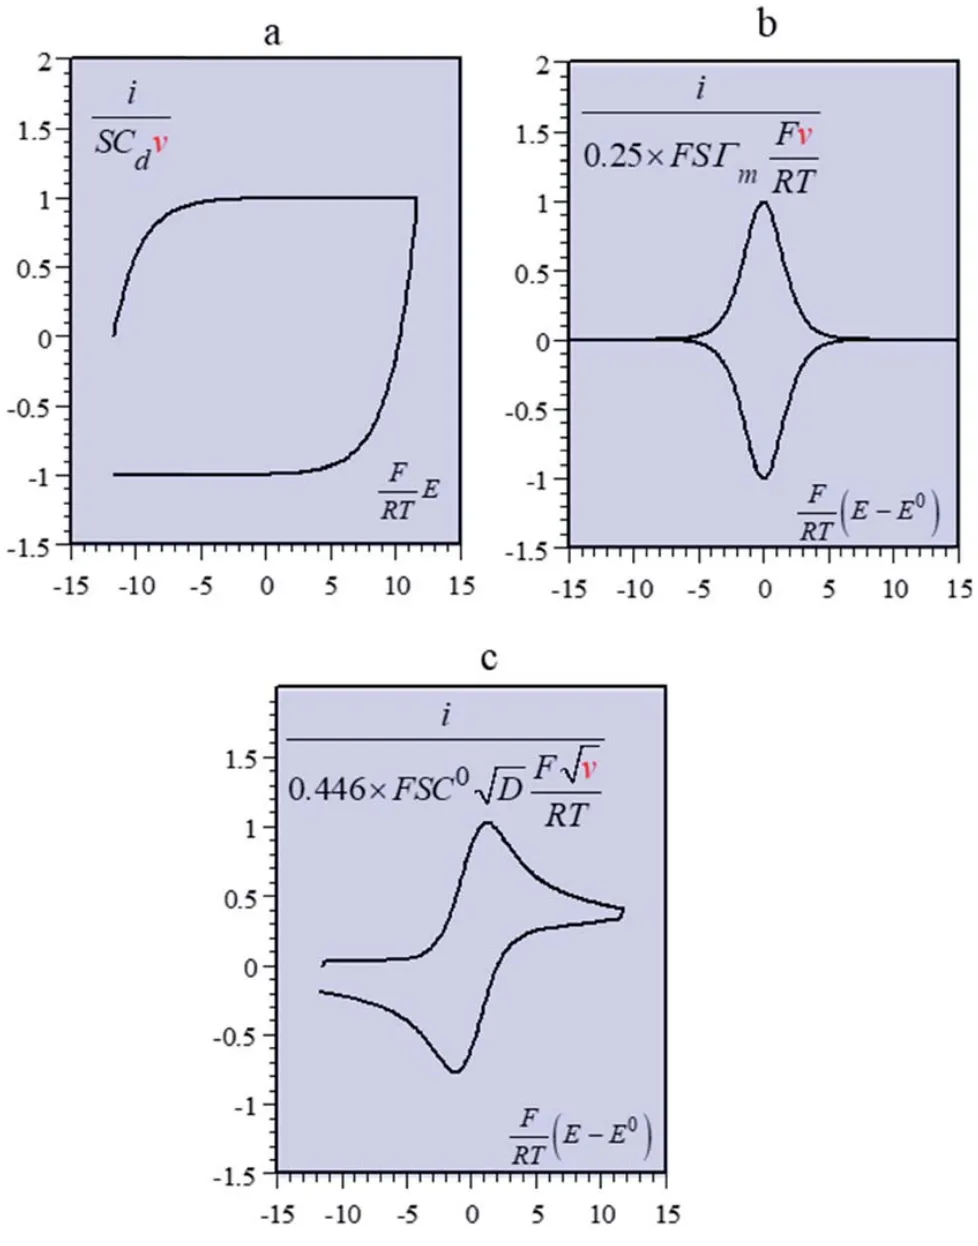
Figure 1. Different electrode processes produce different CV shapes: some exhibit a distinct peak shape, while others are closer to a capacitive response. DOI: 10.1039/C9SC01662G

How to interpret CV curves? 2026

How to Interpret a CV Curve? I. What is CV? What is a CV curve? II. How to interpret the peak positions of a CV curve? What do peaks represent? III. How to interpret the peak current and area of ​​a CV curve? What do current and area represent? IV. How to interpret changes in the scan rate of a CV curve? Does scan rate change peaks, current, and area? V. How to interpret the entire CV curve?   I. What is CV? What is a CV curve? CV stands for cyclic voltammetry. It involves continuously varying the potential of the working electrode within a set range: scanning from a

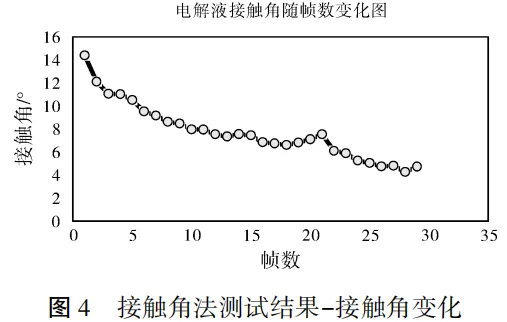
Figure 4 Contact angle variation in contact angle method test

How to evaluate and improve the electrolyte wettability of lithium-ion batteries? 2026

How to evaluate and improve the electrolyte wettability of lithium-ion batteries? First of all, let us understand the factors that affect electrolyte wettability. Factors Affecting Electrolyte Wettability of lithium-ion batteries The essence of electrolyte wettability is the synergistic effect of materials, processes, and structures. The uniformity of wetting can be systematically improved by reducing electrolyte viscosity (e.g., using low-viscosity solvents such as DEC/EMC), adding surfactants (fluorinated wetting agents can significantly reduce surface tension), optimizing electrode porosity (adjusting compaction density to avoid “dead zones”), and adopting vacuum-assisted heating injection processes. Electrolyte wettability directly determines ion transport efficiency, interfacial reaction uniformity, and overall battery performance. Poor wetting can lead to low active

CATL NMC811 vs LFP Batteries: Thermal Runaway Comparison

CATL NMC811 vs LFP Batteries: Thermal Runaway Comparison

  This paper presents a comparative study on the thermal runaway propagation of CATL batteries using NMC811 and LFP as cathode materials. The main conclusions are as follows: Thermal Runaway Propagation Characteristics The peak temperature during thermal runaway of NMC811 batteries (899°C) is significantly higher than that of LFP batteries (524°C). In addition, the thermal runaway propagation speed of NMC811 batteries is five times that of LFP batteries. This indicates that NMC811 batteries require additional safety measures, such as inter-cell spacing and thermal barriers, to meet safety standards. Gas Emission The gas volume, gas flow rate, and gas temperature released by NMC811 batteries during thermal runaway are all higher than

Figure 5: High-Current Discharge Curves of CR2032 Coin Cells

How to resolve the issue of CR2032 batteries being unable to support high-current discharge?

How to resolve the issue of CR2032 batteries being unable to support high-current discharge? During the material R&D phase, it was observed that some CR2032 coin cells failed to discharge normally (Figure 1), which hindered the accurate and rapid acquisition of material performance data. This paper provides a fundamental analysis of why CR2032 lithium-ion coin cells fail to support high-current discharge. Through experimental troubleshooting, a definitive assembly strategy for CR2032 coin cells was established. 1. Introduction to the Assembly Process of CR2032 Lithium-ion Coin Cells 1.1 Instruments Rolling machine (Calender); Punching machine; Coating machine; Glove box; Sealing machine; Battery testing system; Mixer. 1.2 Reagents CR2032 coin cell cases; Copper foil