Neware Battery Testing System

NEWS

Home > News

Figure 4. Regulation of material microstructures via ultrafast sintering. (A) SXRD pattern and Rietveld refinement results of LFP-1000. (B) Fe/Li antisite content of LFP, LFP-900, LFP-1000, and LFP-1100 derived from the Rietveld refinement of SXRD data. (C) PDF patterns in the $r$ range of $2.8\text{–}4.0\text{ \AA}$ for LFP, LFP-900, LFP-1000, and LFP-1100 obtained from synchrotron X-ray total scattering data. (D) FTIR spectra of LFP, LFP-900, LFP-1000, and LFP-1100. (E) In-situ SXRD contour plot recorded during the ultrafast sintering process of LFP. (F) Evolution of Fe/Li antisite content during the ultrafast sintering process, as derived from the corresponding refinement results of in-situ SXRD patterns. HAADF-STEM images of (G) LFP and (H) LFP-1000. (I) Temperature-dependent defect concentrations of four distinct defects ($V_{Li}$, $V_{Fe}$, $V_{O}$, and Fe/Li antisites) calculated via DFT. (J) Formation process of Fe/Li antisites simulated by AIMD. (K) Lithium-ion diffusion coefficients ($D_{Li^+}$) of LFP and LFP-1000 during charging at 8C, derived from the corresponding GITT plots in Figure S33.

Olivine type cathodes with simultaneous regulation of surface-bulk microstructure for long-term fast-charging 2026

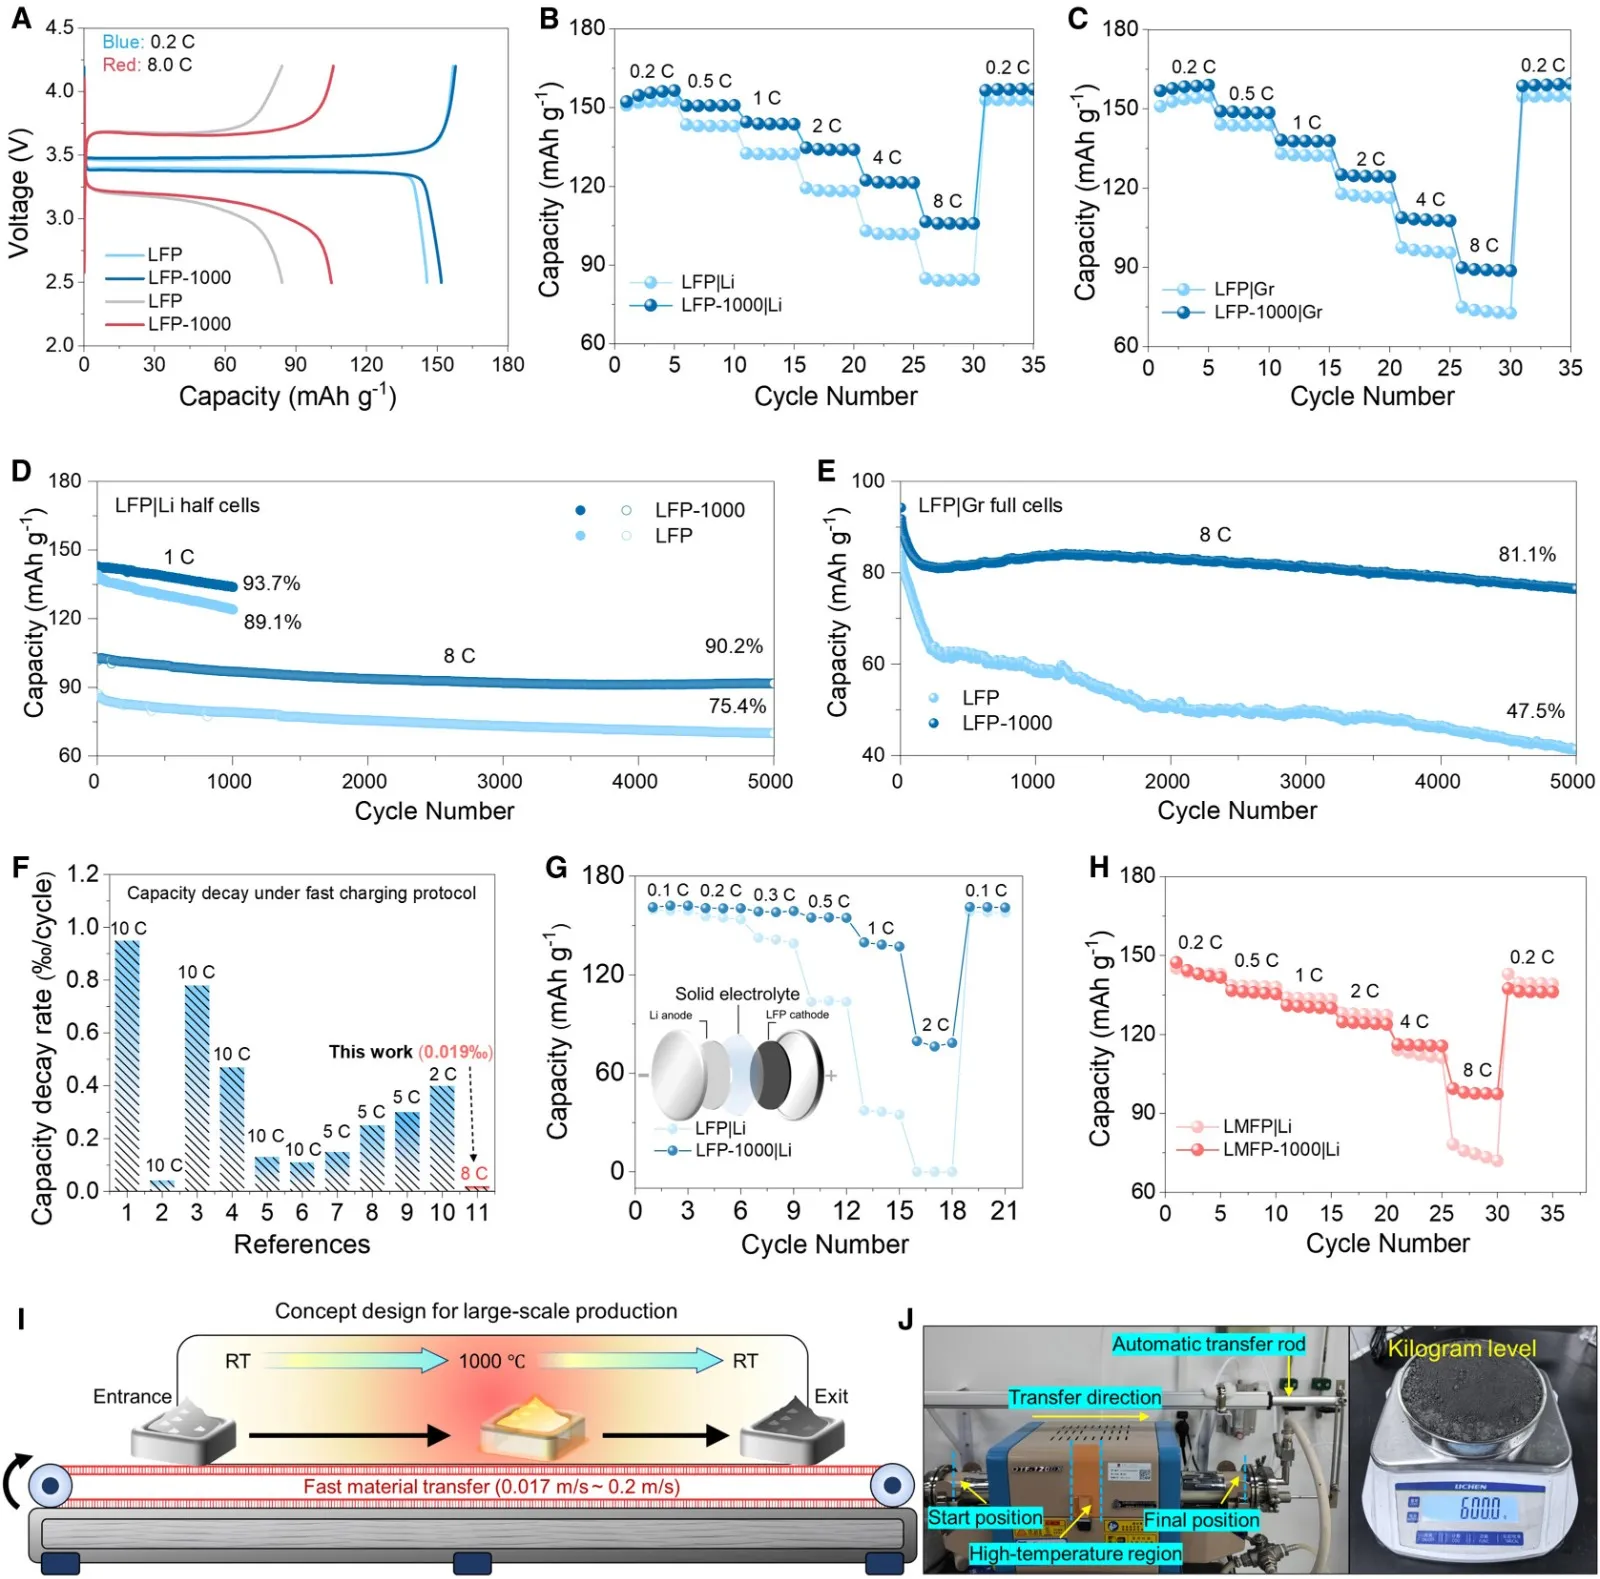
Breaking the Fast-Charging Ceiling! Mingjian Zhang (CUHK), Zuwei Yin (XMU) & Zhiman Liu (Li Auto) in Matter: Ultrafast Sintering Post-treatment Unlocks High-Performance olivine type cathodes First Authors: Yuansheng Lin, Enze Li Corresponding Authors: Mingjian Zhang, Zuwei Yin, Zhiman Liu Equipment Used: This study utilized the Neware MIHW-200-160CH All-in-one Integrated Coin Cell Testing System. Research Background In the wave of next-generation fast-charging technology, a vast amount of existing commercial olivine-type cathode materials (such as lithium iron phosphate, LFP) are facing severe performance bottlenecks. Directly discarding or blindly recycling them would cause immense resource waste and environmental pressure. An intuitive approach to enhancing the fast-charging capability of LFP is to increase the

Battery Charge and Discharge Curves I: Time-Current/Voltage Curves 1. Constant Current (CC)

Introduction to Battery Charge and Discharge Curves 2026

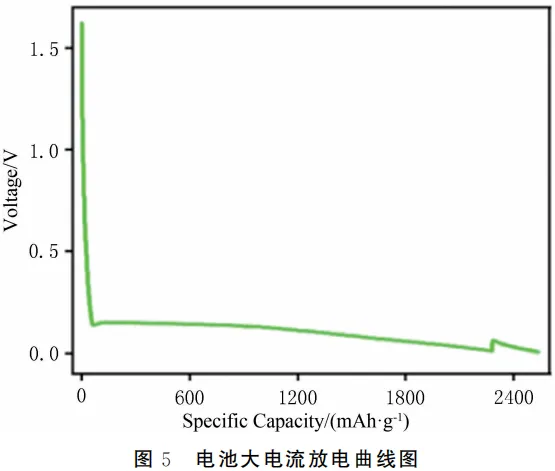
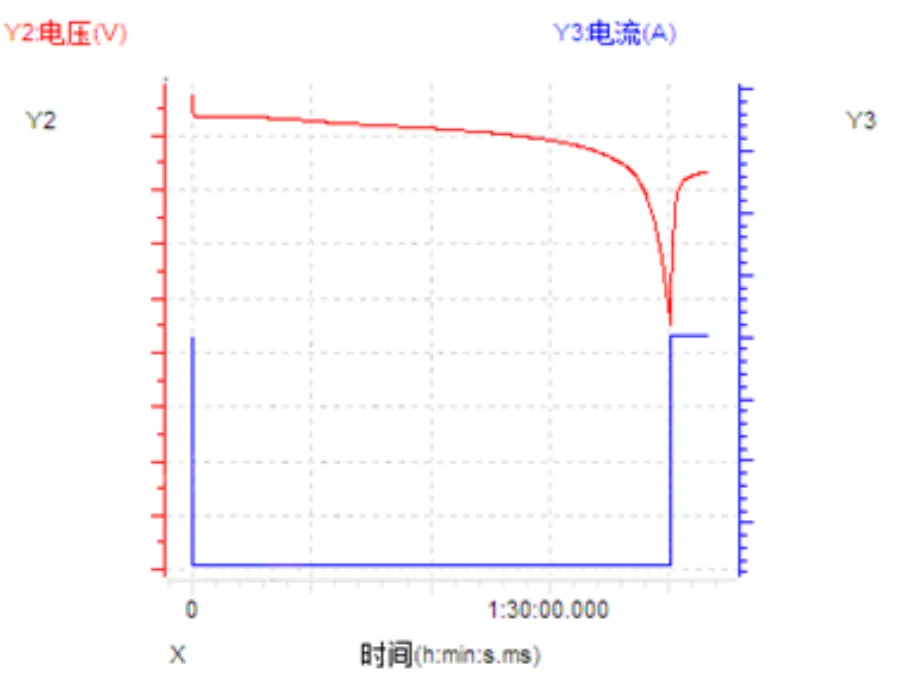
Since lithium-ion batteries (such as cylindrical or pouch cells) typically operate within closed systems to ensure cycling stability and safety, their internal physicochemical states remain difficult to observe directly. Consequently, external electrochemical testing is essential for characterizing and estimating internal cell information. During the charging and discharging process, cell voltage fluctuates according to the Depth of Discharge (DOD). By recording parameters such as voltage, capacity, State of Charge (SOC), and time, we can plot charge-discharge curves that reflect the battery’s electrochemical characteristics. These curves contain critical data regarding polarization phenomena, phase transitions, and kinetic limitations, serving as the foundation for analyzing battery performance. The following sections introduce several common types

Lithium Dendrites

Lithium Dendrite Growth Mechanism and Suppression Methods 2026

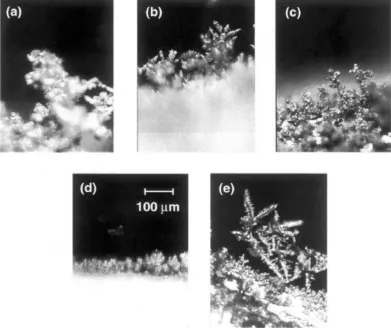
Lithium Dendrite Growth Mechanism and Suppression Methods Lithium metal is considered the ideal anode material for next-generation high-energy-density batteries, such as Lithium-Sulfur and Lithium-Air batteries. This is due to its extremely high specific capacity, low reduction potential, and low density. However, the growth of lithium dendrites severely limits its practical application. Test your battery’s performance with Neware’s high-precision battery testing solution. Lithium dendrites can pierce the separator, leading to short circuits. They also destroy the Solid Electrolyte Interphase (SEI) film. This results in the accumulation of “dead lithium,” capacity fade, and serious safety issues. Today, we will discuss the growth mechanism, influencing factors, characterization techniques, and suppression strategies of lithium

Sulfide-based All-Solid-State Batteries

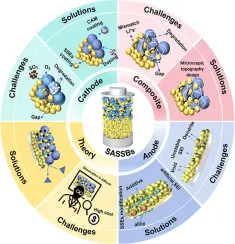
Sulfide-based All-Solid-State Batteries: Core Challenges and Breakthroughs in Materials and Interfaces 1

The massive expansion of the EV market has pushed lithium-ion batteries beyond the 300 Wh/kg threshold, bringing costs down to nearly $100 per kWh. Despite this progress, conventional batteries with liquid electrolytes are hitting a plateau in terms of energy density and safety. All-solid-state batteries are now seen as the core technology for the next generation of EVs, offering higher energy density, better safety, and longer life. In particular, sulfide-based all-solid-state batteries are gaining immense traction because their solid electrolytes can match the high ionic conductivity of liquid systems, making them a top research priority globally. However, the practical application of sulfide-based ASSBs still faces multiple challenges. Technical bottlenecks spanning

Figure 4. Electrochemical Impedance Spectroscopy (EIS) of anode symmetric cells at different SOC: (a) 100% SOC-Pristine symmetric cell; (b) 100% SOC–0% SOC symmetric cell; (c) Equivalent circuit model for impedance analysis.

Anode Symmetric Cells for Battery Capacity Loss Analysis: A Step-by-Step Guide 2026

Insights from “Lithium Battery Frontier” – 锂电前沿 Abstract: Anode symmetric cells were assembled using two identical electrodes, one in a lithium state and another one in a delithiated or pristine state. The charging-discharging regime of graphite symmetric cells were studied. And the electrochemical impedance spectrum of different state of charge(SOC)was also analyzed. A sloping curve from -1 V to 0.5 V was only observed during the first charging curve of the 100% SOC-Pristine graphite symmetric cell. The voltage platform was suggested to the formation of SEI layer in the pristine graphite surface. The impedance of symmetric cell in 0% SOC and 100% SOC reached the maximum. While the impedance achieved

Figure 3 Design and performance analysis of high-current formation strategy

Real-time visualization of SEI formation: Reducing battery formation time from 20 hours to 1 hour

Real-time visualization of SEI formation: Reducing battery formation time from 20 hours to 1 hour Source: WeChat Official Account “Lithium Dream Life” In the lithium-ion battery manufacturing process, there is a critical yet long-standing “invisible” step—Battery Formation. This stage directly determines a battery’s cycle life, safety, and consistency. However, it typically requires 10 to 20 hours or even longer to complete, representing a major source of manufacturing costs and safety risks. Recently, a collaborative research team from the University of Texas at Austin, Purdue University, and General Motors (GM) achieved a breakthrough by directly observing the formation of the Solid Electrolyte Interphase (SEI) under real battery operating conditions for the