
Neware Battery Testing System

How to interpret CV curves? 2026

How to Interpret a CV Curve?

I. What is CV? What is a CV curve?

II. How to interpret the peak positions of a CV curve? What do peaks represent?

III. How to interpret the peak current and area of ​​a CV curve? What do current and area represent?

IV. How to interpret changes in the scan rate of a CV curve? Does scan rate change peaks, current, and area?

V. How to interpret the entire CV curve?


I. What is CV? What is a CV curve?

CV stands for cyclic voltammetry. It involves continuously varying the potential of the working electrode within a set range: scanning from a starting potential to a termination potential, and then scanning back. This “back-and-forth scanning” process is like applying a controlled potential perturbation to the electrode and then observing the resulting current response of the system.

Therefore, CV is not essentially about measuring a voltage or a current, but rather observing the dynamic response of the electrode as the potential changes.

A CV curve plots this response: the horizontal axis is typically potential, and the vertical axis is typically current or current density. The horizontal axis tells us the potential the electrode has been scanned to, and the vertical axis tells us how much charge is passing through the electrode interface at that potential. In other words, the CV curve is not a “fixed curve of the material itself,” but a current-potential response graph obtained under specific electrolyte, reference electrode, potential window, scan rate, and electrode conditions.
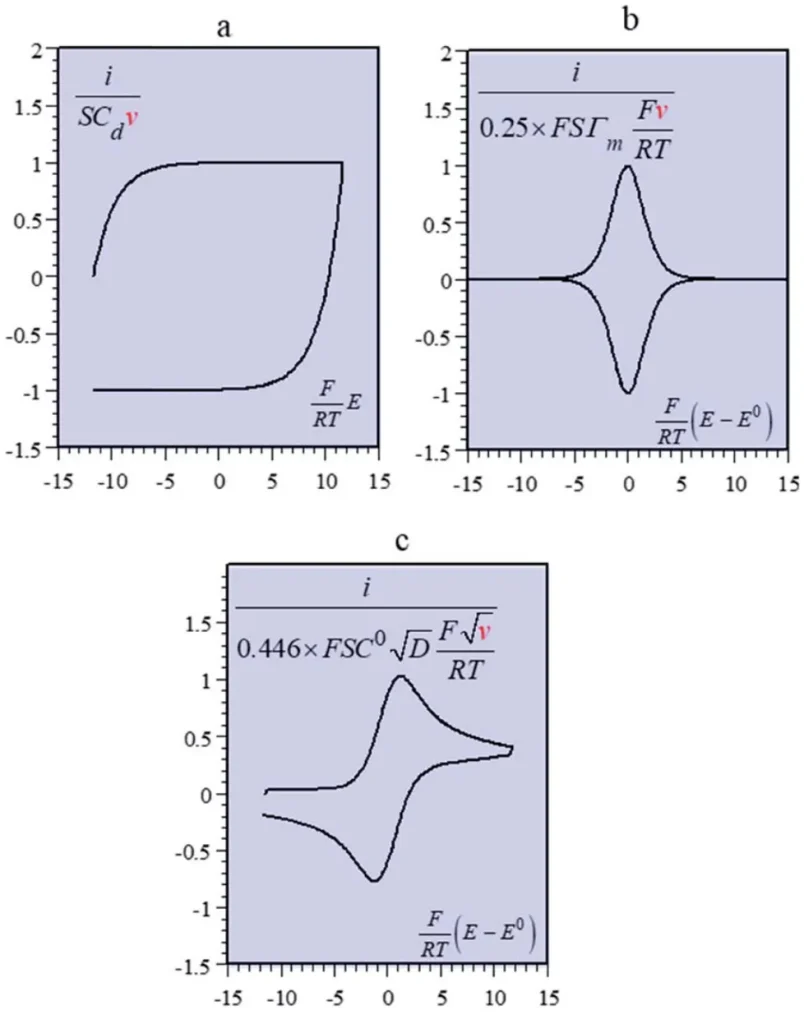
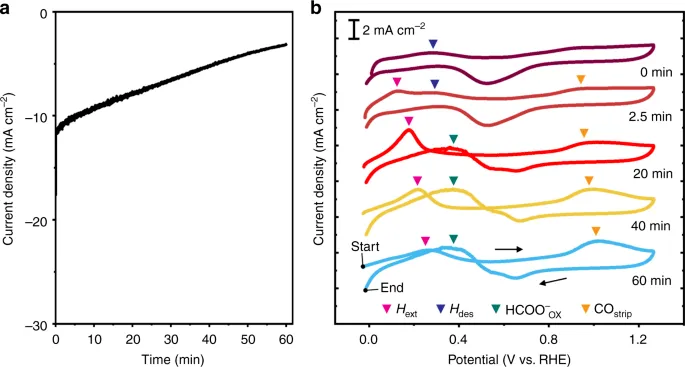
 

Figure 1. Different electrode processes produce different CV shapes: some exhibit a distinct peak shape, while others are closer to a capacitive response. DOI: 10.1039/C9SC01662G


If oxidizable or reducible species are present in the system, electron transfer begins to increase when the potential is scanned to a suitable range, and the current rises accordingly. When reactants near the electrode are consumed, diffusion supply cannot keep up, or the reaction enters a new equilibrium, the current decreases, thus forming a peak.

For electrodes without obvious Faraday reactions, the curve may be closer to a rectangle or sloping background, mainly reflecting double-layer capacitance and interfacial charging and discharging. Understanding this is crucial because the shape of the CV curve is a combination of electrode reactions, mass transfer processes, and interfacial charging and discharging.

Therefore, when interpreting CV curves, the first step is not to rush into comparing peaks and troughs, but to first confirm the potential window, reference electrode, scan direction, scan rate, and ordinate normalization method. Whether the current is A, mA cm⁻², or Ag⁻¹ directly affects whether the curves can be compared; whether the potential is relative to Ag/AgCl, Hg/HgO, SCE, or RHE also affects peak interpretation.

Before interpreting CV data, four things need to be confirmed: what is the potential reference, what is the scan direction, what is the scan rate, and what are the electrolyte and electrode systems? Potentials under different reference electrodes cannot be directly mixed, and peak currents under different scan rates cannot be simply compared.


Figure 2. Current response and redox process in the CV curve; the potential window, scan direction, and peak shape collectively determine the interpretation logic. DOI: 10.1038/s41467-019-11903-5


A single CV curve can reveal a wealth of information, but it’s not enough to simply look for peaks. Some systems exhibit distinct redox peaks, others primarily show near-rectangular capacitive currents, and still others show a gradual increase in the initiation current of an electrocatalytic reaction. The first step in interpreting a CV curve is to determine whether it primarily represents a Faraday reaction, capacitive behavior, or a combination of both.


II. How to interpret the peak positions of a CV curve? What do peaks represent?

Peak position indicates the potential range at which a particular electrochemical process is most pronounced. A peak in a colorimetric analysis (CV) is not an isolated point, but rather the result of an electrode process gradually increasing in intensity, reaching a maximum, and then gradually decreasing within a certain potential range.

Oxidation peaks typically indicate electron loss during a positive scan, while reduction peaks typically indicate electron gain during a reverse or negative scan. The potential corresponding to the peak apex is called the peak potential, such as the oxidation peak potential Epa and the reduction peak potential Epc; the current corresponding to the peak apex is called the peak current, such as ipa and ipc.

The most direct significance of peak position is telling us at what potential range a reaction needs to occur significantly. For a simple reversible redox pair, Epa, Epc, and the half-wave potential E1/2 can help estimate the redox potential; for battery materials, pseudocapacitive materials, or electrocatalytic materials, peak position may also reflect intercalation/deintercalation, phase transitions, adsorption intermediate formation, metal valence state transitions, or surface reconstruction.

More precisely, peak position indicates “the potential range in which this electrode process is most active,” rather than automatically being equated to a unique fingerprint of a particular substance.

A shift in peak position may indicate changes in reaction thermodynamics, electrode interface, mass transfer conditions, active site environment, or kinetic resistance. A more readily reacted peak position does not necessarily mean a higher peak position is always better; the specific reaction direction and system must be considered.
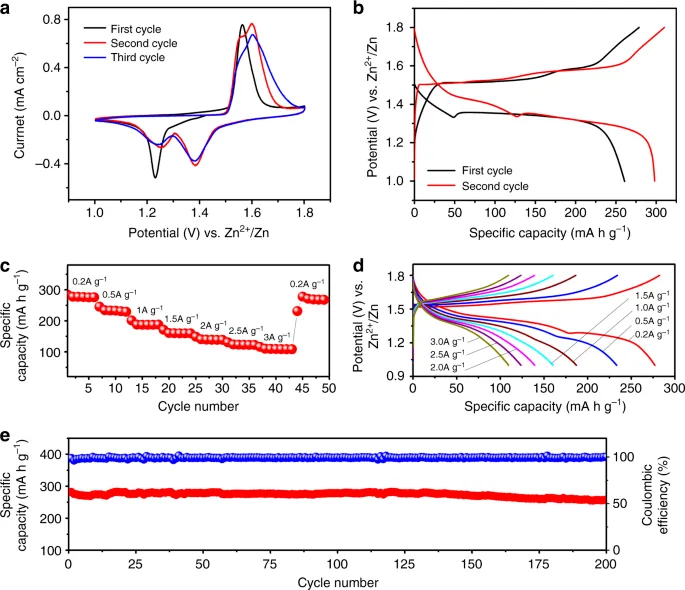
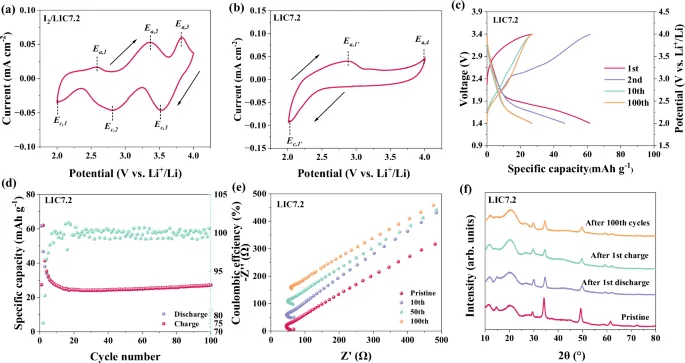
 

Figure 3. Peak positions in the CV curves of battery materials correspond to the charge-discharge reaction process; peak shifts reflect changes in polarization and reaction pathways. DOI: 10.1038/s41467-018-04949-4


If the peak spacing ΔEp = Epa – Epc between a pair of redox peaks is very small, a smaller peak spacing and more symmetrical peaks usually indicate that electron transfer and mass transport are closer to a reversible response. A larger peak spacing, broader peak shape, and weaker reverse scan peaks may indicate enhanced polarization, slower electron transfer kinetics, or subsequent chemical changes in the reaction products.

Peak position should also be considered in conjunction with the potential window. If a peak is close to the edge of the window, it may indicate that the reaction has not fully unfolded. Peak position answers the question of “at which potential the reaction occurs,” not simply “whether the material performance is good or not.”


Figure 4. Relationship between CV peak position and battery redox activity. Peak position and peak spacing can be used to determine reaction reversibility and polarization degree. DOI: 10.1038/s41467-025-56932-5


Sharper peaks are not necessarily better, nor are more peaks necessarily better; the key is whether these peaks correspond to the actual electrode process.


III. How to interpret the peak current and area of ​​a CV curve? What do current and area represent?

Peak current represents the intensity of the reaction current near a certain potential. A larger peak current may indicate more active sites, a faster reaction rate, more efficient mass transfer, or a higher electrode loading. It is crucial to distinguish between normalization methods: normalization by geometric area, electrochemical active area, mass, or active sites yields entirely different meanings.

The area under the curve is related to the amount of charge, as the integral of current over time equals the charge. In pseudocapacitive, battery-type electrodes, or surface redox processes, a larger area often indicates a greater amount of charge participating in the reaction. However, the area can also be affected by background capacitance, electrolyte decomposition, side reactions, and the scanning window. The area represents the charge response but does not automatically equal the true capacity or the true number of active sites.
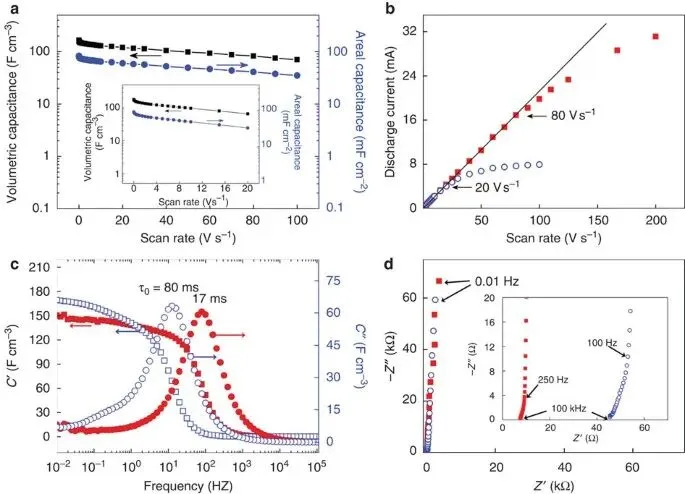
 

Figure 5. Changes in the area under the current curve (CV) and current response at different scan rates, which can be used to understand capacitive behavior and charge storage capacity. DOI: 10.1038/ncomms2970


What do current and area represent? The essence of electric current is the amount of charge passing through the electrode interface per unit time. The current in a CV curve can originate from both Faraday and non-Faraday processes. The former corresponds to actual electron transfer, such as redox reactions, ion insertion/deintercalation, and the transformation of adsorption intermediates; the latter mainly corresponds to double-layer charging and discharging, where the electrode/electrolyte interface stores and releases charge like a capacitor.

Therefore, the current on a CV curve does not all originate from the target reaction; peak current, background current, and capacitive current need to be understood separately. The peak current ip typically reflects the maximum response intensity of a Faraday process near a certain potential. It is influenced by reactant concentration, diffusion coefficient, electron transfer rate, effective electrode area, material loading, pore structure, and scan rate.

For electrocatalytic materials, simply observing a larger CV current for a particular sample does not necessarily indicate stronger intrinsic activity, as a larger electrode area, higher loading, better conductive network, or higher background capacitance can all increase the current.

This is why the normalization method must be considered when comparing CV curves. Normalization using geometric area yields current density, commonly measured in mA cm⁻²; normalization using mass yields Ag⁻¹; further normalization using ECSA or the number of active sites provides a closer comparison of intrinsic characteristics. The meaning of “high” or “low” on the same curve differs depending on the normalization method.

The area under a CV curve is often used to discuss capacity, capacitance, or charge storage capability, but it’s crucial to clarify what “area” actually refers to. The area is related to charge, but the scan rate and integration interval must be considered simultaneously.

For supercapacitors or pseudocapacitive materials, a larger area enclosed by the CV curve generally means that the electrode can store or release more charge within the same potential window and scan rate.

For systems with prominent redox peaks, the integrated area under a peak reflects the amount of charge involved in the electrode process, thus relating to the number of active species, the degree of reaction, or the insertion/extraction capacity. However, directly comparing areas becomes meaningless if the scan rate, electrode loading, potential window, or normalization method differs.

Therefore, a more accurate description of “large area” is: under given test conditions, the electrode exhibits a greater charge response within that potential window. This could stem from more reversible ion adsorption, stronger pseudocapacitance, higher specific surface area, higher loading, or even a larger background capacitance or side reaction current. Area can help determine charge storage capability but cannot independently demonstrate the material mechanism.


IV. How to interpret changes in the scan rate of a CV curve? Does scan rate change peaks, current, and area?

With variations in scan rate, the peak positions, peak currents, and curve shapes all change. In diffusion-controlled processes, it is common to see an approximately linear relationship between the peak current and v^1/2; for surface-controlled or pseudocapacitive processes, the peak current is closer to being linear with v. If peak positions become significantly separated and the peak shape widens as the scan rate increases, it indicates that polarization and kinetic limitations are enhanced.
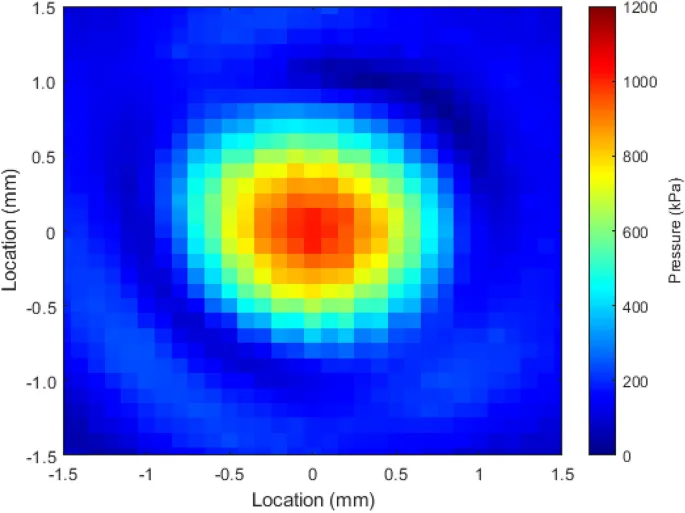
Figure 6. The effect of scan rate on the peak current and peak shape of CV curves, which can be used to distinguish between diffusion-controlled and surface-controlled processes. DOI: 10.1038/s41598-021-82240-1


Common b-value analysis utilizes i = av^b to determine kinetic characteristics. When b approaches 0.5, the diffusion-controlled contribution is more pronounced; when b approaches 1, the surface-controlled or capacitive contribution is more pronounced. However, the b-value depends on the potential range and data processing, so a single b-value cannot be treated as the sole label for the entire system.
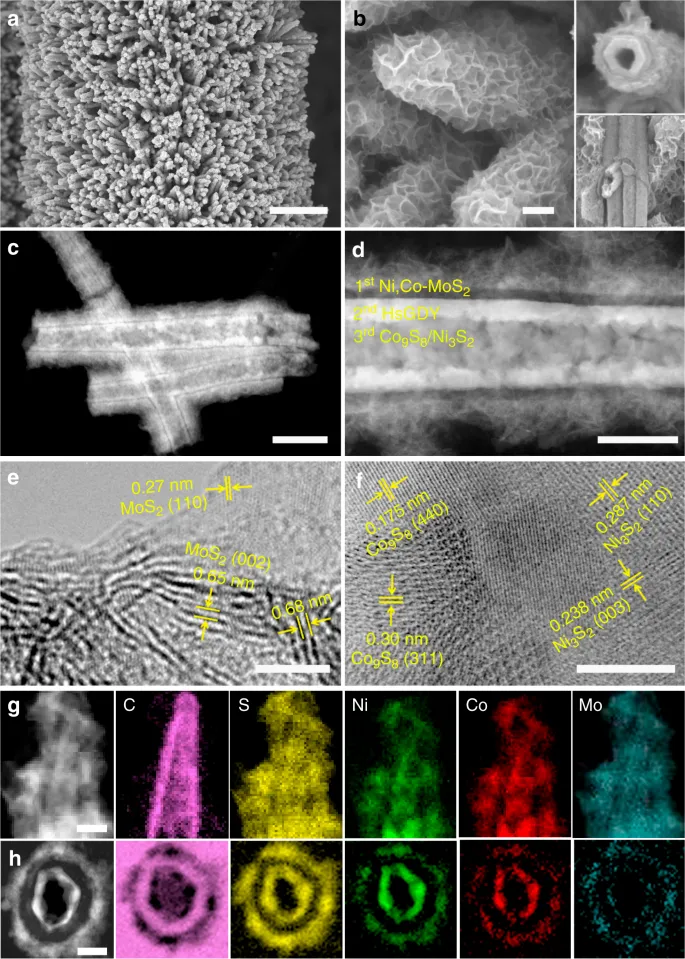
Figure 7. Analysis of CV curves and kinetic contributions at different scan rates, which can be used to determine the relative contributions of surface-controlled and diffusion-controlled processes. DOI: 10.1038/s41467-018-05474-0

Do scan rates change peaks, current, and area? For the same material at different scan rates, the CV curves can vary significantly. The faster the scan rate, the quicker the potential changes per unit time, which often leads to an increase in current; however, at the same time, ion diffusion and charge transfer may not fully keep up, causing peak positions to shift, peak shapes to widen, and the separation between the anodic and cathodic peaks to potentially increase. In other words, the scan rate is not just a test parameter; it essentially alters the time scale on which the electrode process is observed.

The common diagnostic logic is: if the peak current ip is approximately linear with v^1/2, it typically indicates that the process is closer to being diffusion-controlled; if ip is linear with v, it is more likely to be surface-controlled or capacitive control.

In battery and pseudocapacitive materials, i = av^b is also commonly used to analyze the contributions, where a b-value close to 0.5 indicates that diffusion control is more pronounced, and a b-value close to 1 indicates that the surface capacitance contribution is more pronounced. What is truly critical is that changing the scan rate does not just change the magnitude of the current; it also alters the peak positions, peak shapes, and the time window available for reactions to participate.

Therefore, if only a single scan rate is shown in the same graph, the information it can convey is limited; if a set of CV curves at different scan rates is displayed, one can further determine the growth pattern of the peak current, changes in curve area, kinetic polarization, and charge storage mechanisms. For energy storage materials, this step is particularly important because it allows the “seemingly large area” to be further broken down into diffusion contribution, surface contribution, and capacitive contribution.

V. How to interpret the entire CV curve?

A CV curve is best read in the order of “conditions, shape, peak positions, peak current, and scan rate response.”

First, confirm the potential window and reference electrode, then determine whether the curve is peak-shaped, rectangular, or a current-climbing type; subsequently, look at the peak positions and peak separation to judge the reaction potential and reversibility; then look at the peak current and area to evaluate the reaction intensity; and finally, use the scan rate response to determine the kinetic origin.

When truly reading a CV plot, you can first look at the potential window and scan direction, and then check whether there are obvious redox peaks. If there are peaks, judge the peak positions, peak separation, and whether the anodic and cathodic peaks correspond to each other; if there are no obvious peaks, judge whether it approaches a rectangular capacitive response, or if there is tilting, polarization, or an excessively large background current. Next, look at the magnitude of the current, but simultaneously confirm the electrode area, mass loading, and normalization method; lastly, look at the area or integrated charge, and confirm that it is being compared under the same potential window, same scan rate, and same normalization method.

If used for material comparison, the electrode preparation, mass loading, electrolyte, scan rate, reference electrode conversion, and iR correction method must be kept consistent. Otherwise, a larger peak in one sample might simply be due to a higher loading; a peak appearing earlier in one sample might just be due to a different reference electrode conversion; and a larger area in one sample could stem from the background current.

For electrocatalysis, CV can help identify surface redox, activation processes, non-Faradaic regions, and information related to the electrochemical active surface area; for energy storage materials, CV is more commonly used to determine reaction potentials, polarization magnitude, reversibility, rate response, and capacitive/diffusion contributions; for electroanalysis, peak positions, peak currents, and peak areas are frequently used to identify analytes, establish concentration relationships, and evaluate detection sensitivity.

In different applications, the way of reading the curves varies slightly, but the underlying logic is consistent: peaks indicate positions and processes, current indicates response and rates, and area indicates charge and the total amount of storage/conversion.
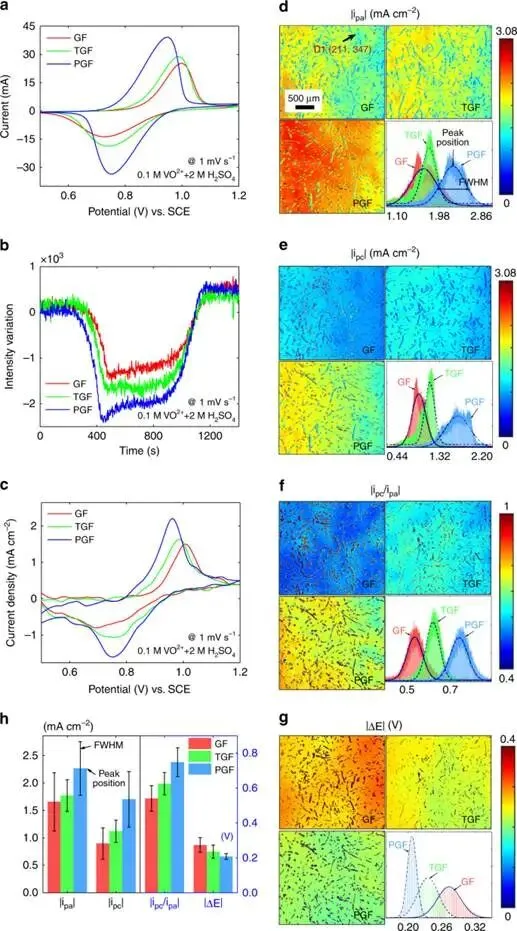
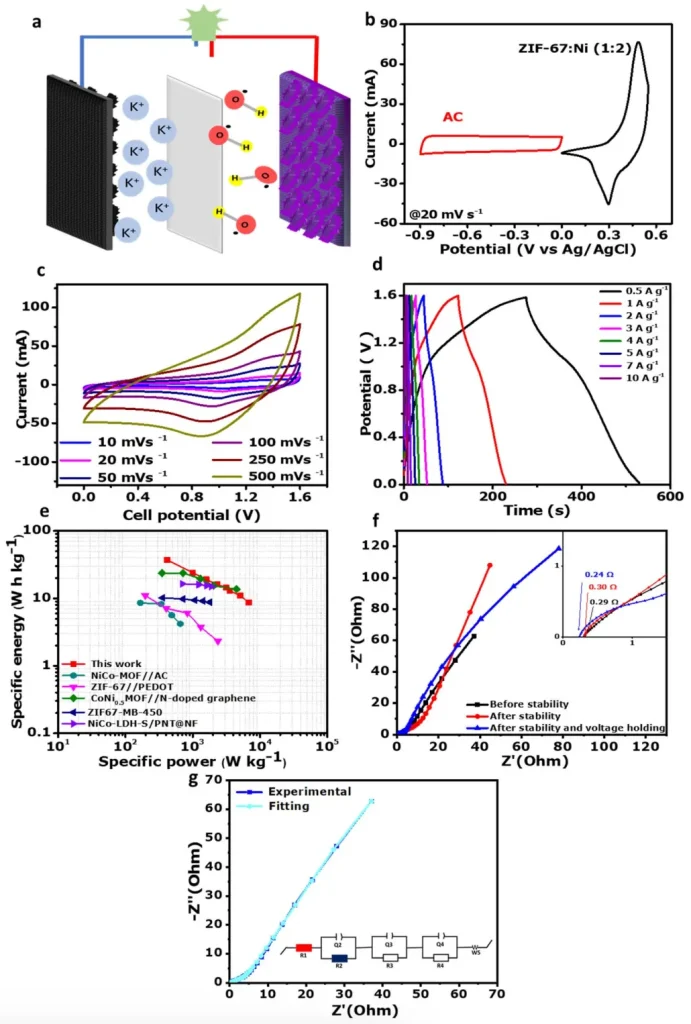
 

Figure 8. Comprehensive analysis of CV curves and local electrochemical responses, indicating that the interpretation of the plots requires a combined consideration of current, peak shape, spatial distribution, and reaction conditions. DOI: 10.1038/s41467-019-13147-9
Figure 9. CV curves in devices or material systems require a simultaneous comparison of peak positions, peak currents, curve areas, and scan rate responses to determine charge storage and kinetic characteristics. DOI: 10.1039/D5RA05741H


Neware has been continuously conducting research and development based on customer needs. Please look forward to our upcoming products equipped with CV and EIS functions.